
Introduction
If you’ve ever looked at a stock chart and felt like you’re staring at a foreign language — you’re not alone. Every successful investor and trader once started there.
Understanding how to read stock charts and indicators is one of the most powerful skills in investing. It helps you identify entry and exit points, predict trends, and make data-driven decisions — instead of relying on luck or news hype.
In this guide, you’ll learn how to read stock charts like a pro — including candlesticks, moving averages, volume, RSI, MACD, Bollinger Bands, and trendlines — all simplified for beginners in the Indian stock market.
1. What Is a Stock Chart and Why Does It Matter?
A stock chart visually represents a stock’s price movement over time.
It tells a story of how buyers and sellers interacted in the market.
You can use it to:
- Identify trends (uptrend, downtrend, sideways)
- Spot entry/exit points
- Understand market psychology
- Avoid emotional or impulsive decisions
Types of Charts Commonly Used:
| Chart Type | Description | Suitable For |
|---|---|---|
| Line Chart | Connects closing prices with a line | Beginners |
| Bar Chart | Shows open, high, low, close | Intermediate traders |
| Candlestick Chart | Visually rich, color-coded chart | Most traders/investors |
| Heikin-Ashi Chart | Smoothens price trends | Trend-following traders |
💡 Pro tip: In India, popular platforms like TradingView, Zerodha Kite, and Groww let you view real-time candlestick charts for NSE/BSE stocks.
2. The Basics of Candlestick Charts
Candlesticks are the foundation of technical analysis. Each “candle” represents price movement within a specific time frame (1 minute, 5 minutes, 1 day, 1 week, etc.).
Anatomy of a Candle:
- Body: Shows the opening and closing prices.
- Wicks/Shadows: Show the highest and lowest prices.
- Colors:
- 🟩 Green (or white) → Price closed higher (bullish candle)
- 🟥 Red (or black) → Price closed lower (bearish candle)
Example:
If Reliance opened at ₹2,300 and closed at ₹2,350 — the candle is green (bullish).
If it closed at ₹2,250, it’s red (bearish).
Candlestick charts make it easy to spot reversals, breakouts, or consolidation zones at a glance.
3. Understanding Trends — The Market’s Direction
“The trend is your friend.” This old saying still rules the stock market.
There are three main types of trends:
| Trend | Description | Action |
|---|---|---|
| Uptrend | Series of higher highs and higher lows | Buy or hold |
| Downtrend | Series of lower highs and lower lows | Avoid or short-sell |
| Sideways trend | Range-bound movement | Wait for breakout |
How to Identify:
Draw trendlines connecting at least two or three points on the chart:
- Support line → connects lows
- Resistance line → connects highs
When the stock price breaks above resistance with volume, it signals bullish momentum.
4. Key Indicators Every Investor Should Know
a) Moving Averages (MA)
A moving average smoothens price data to identify overall trends.
- Simple Moving Average (SMA): Average of closing prices over a period (e.g., 50-day SMA).
- Exponential Moving Average (EMA): Gives more weight to recent prices (faster signal).
💡 Common Strategy:
If 50-day EMA crosses above 200-day EMA → Golden Cross (bullish)
If 50-day EMA crosses below 200-day EMA → Death Cross (bearish)
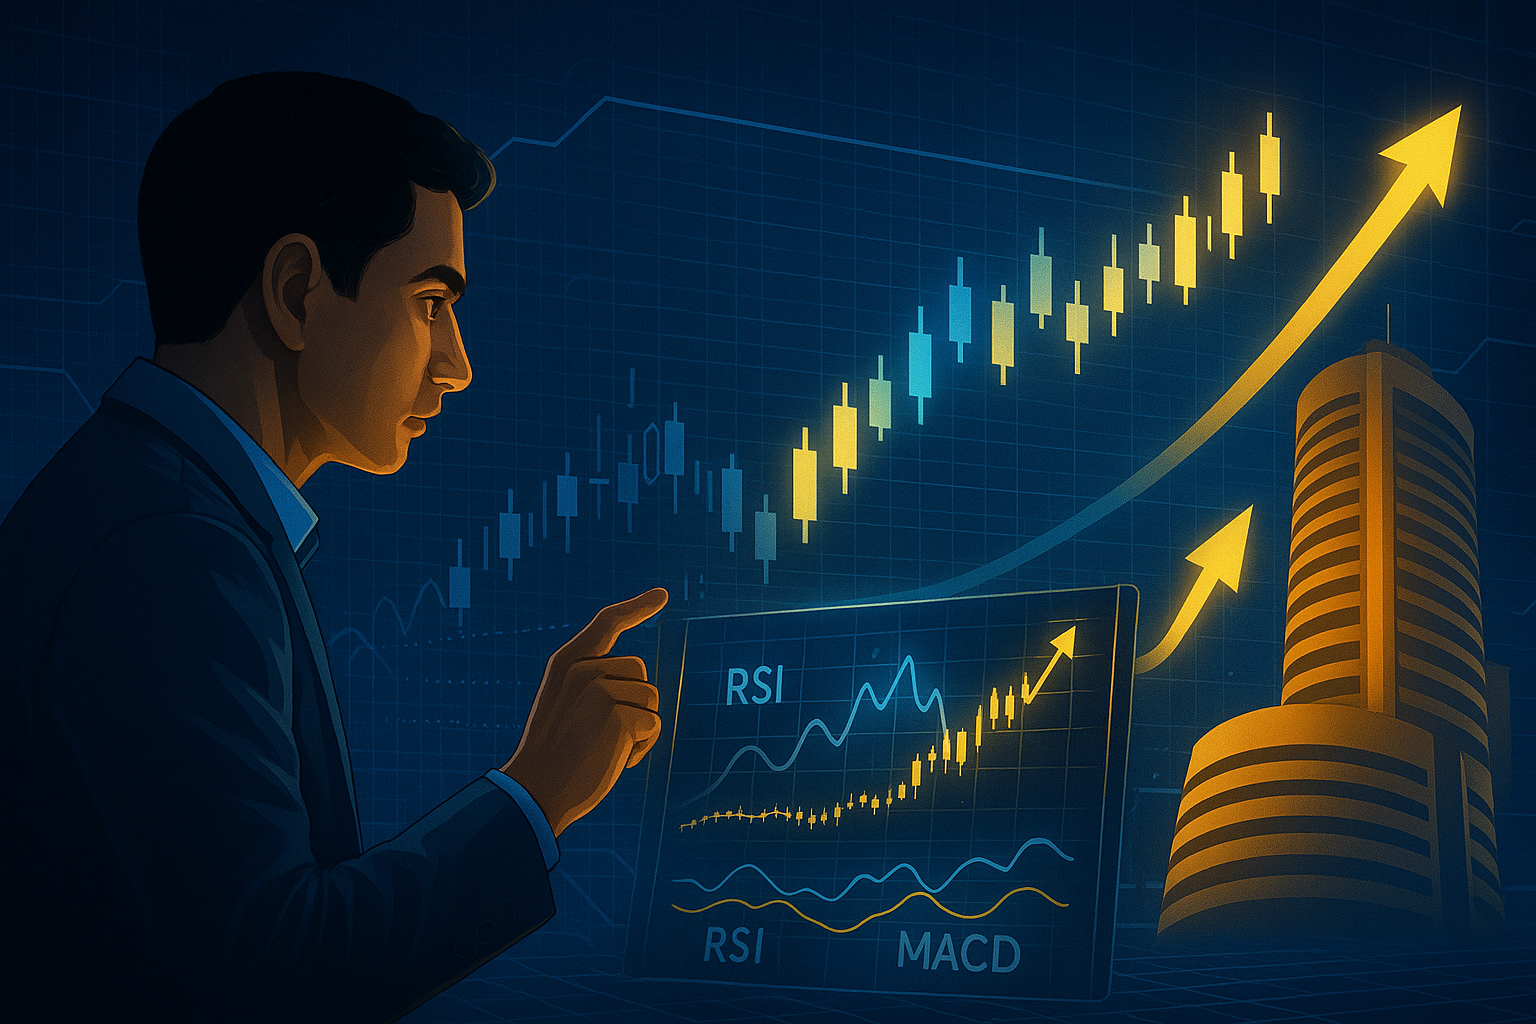
b) Relative Strength Index (RSI)
RSI measures momentum — whether a stock is overbought or oversold.
📊 RSI scale: 0 to 100
- Above 70 → Overbought (possible correction)
- Below 30 → Oversold (possible bounce)
💡 Tip: Combine RSI with volume and price action for confirmation.
c) MACD (Moving Average Convergence Divergence)
MACD identifies trend direction and momentum strength.
It consists of:
- MACD Line (difference between two EMAs)
- Signal Line
- Histogram (visual representation)
💡 Interpretation:
- MACD line crosses above Signal line → Buy signal
- MACD line crosses below Signal line → Sell signal
It’s especially useful in detecting early trend reversals.
d) Bollinger Bands
Bollinger Bands measure volatility and consist of:
- Middle band: 20-day SMA
- Upper band & Lower band: ±2 standard deviations
💡 Interpretation:
- Price touches upper band → overbought (sell signal)
- Price touches lower band → oversold (buy signal)
- Bands contract → low volatility (possible breakout ahead)
- Bands expand → high volatility (trading activity increasing)
e) Volume
Volume shows the number of shares traded. It’s the fuel behind every price move.
- Rising prices + high volume = Strong uptrend
- Falling prices + high volume = Strong downtrend
- Breakouts are valid only with above-average volume
In short, price tells you what, but volume tells you why.
5. Support and Resistance — The Battle Lines
Support and resistance levels are psychological zones where buyers and sellers fight for control.
- Support: A price level where buying pressure prevents further fall.
- Resistance: A level where selling pressure prevents further rise.
How to Use:
- Buy near support
- Sell near resistance
- Wait for breakout with volume confirmation
📈 Example:
If HDFC Bank keeps bouncing near ₹1,400, that’s support.
If it keeps failing near ₹1,500, that’s resistance.
A breakout above ₹1,500 = bullish continuation.
6. Chart Patterns You Must Learn
Patterns are visual shapes formed by price action that signal potential movements.
| Pattern | Type | Meaning |
|---|---|---|
| Head and Shoulders | Bearish | Trend reversal downwards |
| Double Top/Bottom | Both | Reversal pattern |
| Cup and Handle | Bullish | Continuation pattern |
| Flag and Pennant | Bullish | Short pause before uptrend continues |
| Triangle (Ascending/Descending) | Both | Breakout direction decides trend |
Learning to identify these helps predict market breakouts before they happen.
7. Combining Indicators — The Smart Way
Never rely on a single indicator.
Professionals use a combination of 2–3 indicators to confirm a signal.
Example of a simple setup:
- 50-day EMA (trend direction)
- RSI (momentum)
- Volume (confirmation)
If:
✅ Price above 50 EMA
✅ RSI between 50–70
✅ Volume rising
→ That’s a strong buy signal in most market conditions.
8. Common Mistakes Beginners Make
Avoid these traps most new traders fall into:
❌ Overloading charts with too many indicators
❌ Ignoring the larger time frame
❌ Trading without stop-loss
❌ Following random social media tips
❌ Emotional trading during volatility
📍 Rule: Keep your chart clean and strategy simple.
9. How to Practice Reading Charts
The best way to learn is by doing.
Here’s how you can practice effectively:
- Open TradingView or Zerodha Kite
- Select a stock (like Infosys or Reliance)
- Try identifying:
- Trend direction
- Support and resistance
- Candlestick formations
- RSI & MACD crossovers
- Keep a trading journal to note your observations and predictions.
Over time, you’ll start recognizing chart behavior patterns instinctively.
10. Pro Tips for Reading Stock Charts Like an Expert
🔥 Use multi-timeframe analysis — confirm trends on daily, weekly, and monthly charts.
🔥 Wait for confirmation candles before acting on a signal.
🔥 Combine fundamental and technical analysis for safer long-term investing.
🔥 Use stop-loss always to limit downside.
🔥 Watch Nifty 50 and sector charts to identify overall market trend.
Remember, charts aren’t just lines and colors — they’re human emotions in visual form: fear, greed, hope, and panic.
Learning to read them helps you stay calm when others react emotionally.
11. Tools and Platforms to Use in India
For Indian investors, these are the most reliable and beginner-friendly charting tools:
| Platform | Features |
|---|---|
| TradingView | Advanced technical tools, indicators, community scripts |
| Zerodha Kite | Integrated with Demat account, real-time NSE/BSE charts |
| Groww / Upstox | Easy for beginners |
| Investing.com | Free charts and global market analysis |
| MarketSmith India | Focused on long-term trend identification |
Most of them allow free charting, so you can start practicing right away.
Conclusion: Mastering the Market’s Language
Stock charts may seem complicated at first, but with practice, they become second nature.
Once you understand how to read candlesticks, spot trends, and use indicators, you’ll make far more confident investment decisions.
In the end, technical analysis isn’t about predicting the future — it’s about understanding probabilities.
And when combined with discipline, it can help you ride market waves instead of being drowned by them.
So, open that chart, draw your lines, and let the numbers tell you their story — because every chart hides an opportunity waiting to be discovered.


Leave a Reply