

🏛️ Introduction: The Foundation of Smart Investing
Every company tells a financial story — and the balance sheet is the chapter that reveals its true financial strength.
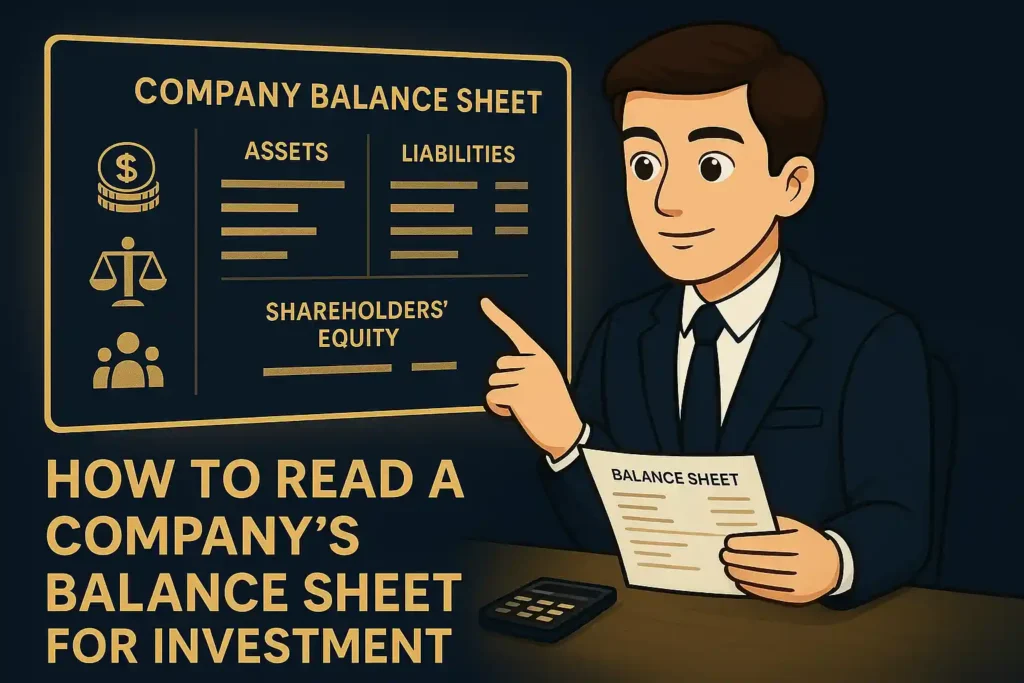
For investors, learning how to read a balance sheet is like learning how to read an X-ray: it uncovers what’s really happening inside a business, beyond just profits or share prices.
A well-understood balance sheet helps investors answer questions like:
- Is the company financially healthy?
- Can it sustain growth and pay its debts?
- Is it a good long-term investment or a risky short-term play?
In this guide, we’ll decode every part of the balance sheet — assets, liabilities, and shareholders’ equity — so you can confidently evaluate companies like a professional investor.
💡 What Is a Balance Sheet?
A balance sheet is one of the three key financial statements (along with the income statement and cash flow statement).
It provides a snapshot of a company’s financial position at a specific point in time — showing what it owns (assets), what it owes (liabilities), and what’s left for shareholders (equity).
🧾 Formula:
Assets = Liabilities + Shareholders’ Equity
This simple equation is the foundation of all accounting and investing analysis.
🧱 Structure of a Balance Sheet
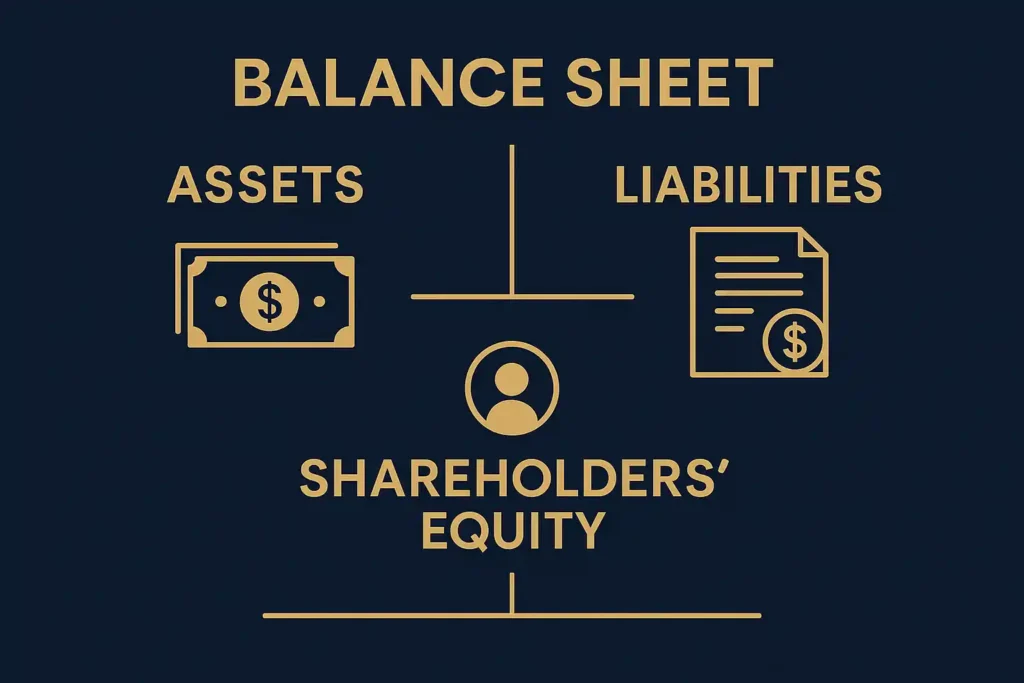
A standard company balance sheet has three main sections:
1. Assets (What the Company Owns)
Assets represent everything the company owns that has monetary value. They are typically split into:
🔹 Current Assets
- Cash & Cash Equivalents
- Accounts Receivable
- Inventory
- Short-term Investments
These are assets that can be converted into cash within a year.
🔹 Non-Current (Fixed) Assets
- Property, Plant & Equipment (PPE)
- Long-term Investments
- Patents, Trademarks, and Goodwill
These generate long-term value for the company.
Investor Tip: A company with strong current assets and manageable debt often has a solid liquidity position.
2. Liabilities (What the Company Owes)
Liabilities are the company’s financial obligations — money it must repay to others.
🔸 Current Liabilities
- Accounts Payable
- Short-term Loans
- Accrued Expenses
🔸 Long-term Liabilities
- Bonds Payable
- Long-term Loans
- Pension Obligations
Investor Insight: A healthy company keeps its debt-to-equity ratio moderate. Too much debt can signal risk, especially when interest rates rise.
3. Shareholders’ Equity (What Belongs to Owners)
This represents the residual interest in company assets after liabilities are paid.
Formula:
Shareholders’ Equity = Total Assets – Total Liabilities
It includes:
- Common Stock
- Retained Earnings
- Additional Paid-in Capital
Example: If a company has ₹500 crore in assets and ₹300 crore in liabilities, equity = ₹200 crore.
This ₹200 crore belongs to the shareholders.
📊 Step-by-Step: How to Analyze a Balance Sheet for Investment
Step 1: Check Total Assets and Growth Trends
Look for steady growth in assets over the years — it often indicates expansion and business reinvestment.
👉 Example: A company’s total assets rising from ₹1,000 crore to ₹1,400 crore in two years shows potential growth.
Step 2: Evaluate Liquidity (Current Ratio)
Formula:
Current Ratio = Current Assets ÷ Current Liabilities
A healthy ratio is 1.5 to 2.0.
If it’s below 1, the company might struggle to pay short-term obligations.
Step 3: Analyze Leverage (Debt-to-Equity Ratio)
Formula:
D/E Ratio = Total Debt ÷ Shareholders’ Equity
- D/E < 1 → Financially stable
- D/E > 2 → Potentially risky
High leverage can magnify profits in good times but cause losses during downturns.
Step 4: Look at Working Capital
Working Capital = Current Assets – Current Liabilities
Positive working capital means the company can fund its operations comfortably.
Step 5: Study Retained Earnings
Retained earnings reflect profit kept for reinvestment, not distributed as dividends.
Consistent growth here is a sign of profitability and expansion potential.
Step 6: Examine Asset Quality
Check whether assets are real and productive — not inflated or non-performing.
Example: A company showing ₹800 crore in assets but ₹500 crore locked in slow-moving inventory might not be as strong as it seems.
Step 7: Compare Over Time and Across Competitors
Analyzing balance sheets across multiple years and industry peers provides a realistic picture.
📈 Example: Compare Tata Motors’ debt-to-equity ratio with Mahindra & Mahindra to gauge sector positioning.
💼 Important Financial Ratios Derived from Balance Sheets
| Ratio | Formula | Meaning |
|---|---|---|
| Current Ratio | Current Assets ÷ Current Liabilities | Measures liquidity |
| Quick Ratio | (Current Assets – Inventory) ÷ Current Liabilities | Assesses immediate liquidity |
| Debt-to-Equity Ratio | Total Debt ÷ Shareholders’ Equity | Evaluates leverage |
| Return on Equity (ROE) | Net Income ÷ Shareholders’ Equity | Measures profitability |
| Asset Turnover Ratio | Net Sales ÷ Total Assets | Shows how efficiently assets generate revenue |
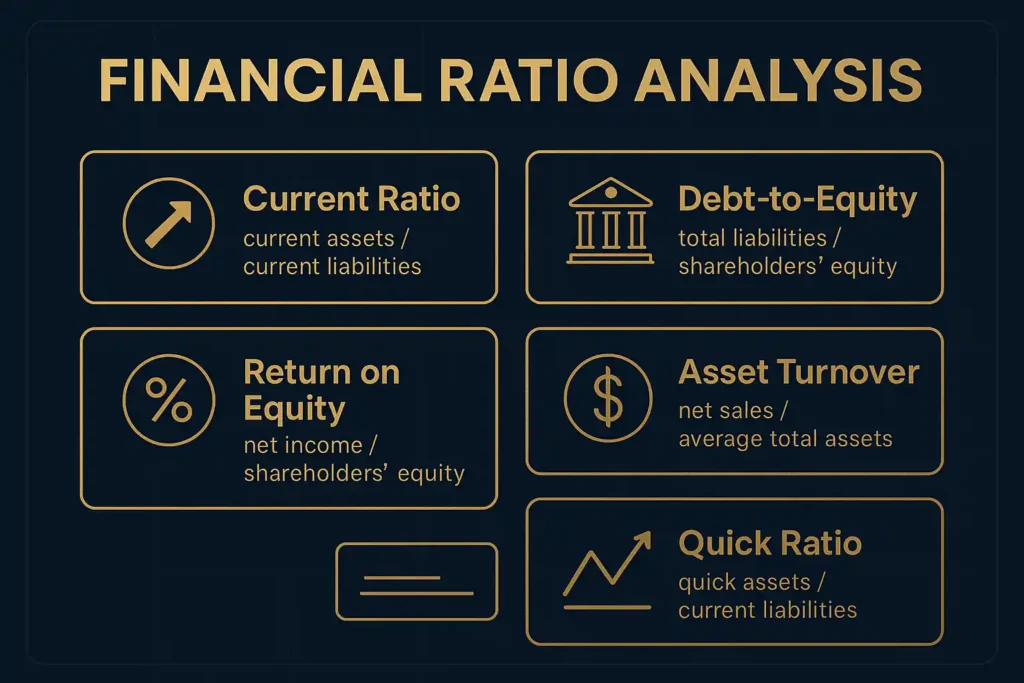
Pro Tip: Combine these ratios with other metrics like P/E or ROE to form a comprehensive view.
🔍 Real-World Example: Infosys Ltd.
Let’s apply this to a real company — Infosys Limited.
| Category | Data (2024) |
|---|---|
| Total Assets | ₹151,000 crore |
| Total Liabilities | ₹54,000 crore |
| Shareholders’ Equity | ₹97,000 crore |
| Current Ratio | 1.8 |
| Debt-to-Equity Ratio | 0.55 |
✅ Interpretation: Infosys maintains strong liquidity, minimal debt, and consistent retained earnings — ideal indicators for a long-term investor.
💰 Why Balance Sheets Matter to Investors
- Reveals Financial Strength – Understand how well the company can survive tough market conditions.
- Highlights True Value – Detect undervalued or overvalued stocks.
- Assesses Risk – Identify overleveraged companies before investing.
- Supports Long-Term Decisions – A must for value investors focusing on fundamentals.
🧭 Common Red Flags in a Balance Sheet
🚩 High Short-Term Debt – Risk of liquidity crisis.
🚩 Rising Receivables – Possible collection issues.
🚩 Negative Equity – Financial distress or consistent losses.
🚩 Large Intangible Assets – Could mean overvaluation or weak asset base.
📘 Conclusion: Balance Sheets Don’t Lie
A balance sheet may look like a table of numbers — but to a smart investor, it’s a roadmap to truth.
Learning to interpret it helps you spot financial strength, avoid weak companies, and invest confidently.
Combine balance sheet analysis with income statements and cash flow insights to form a complete fundamental view of any stock.
In investing, numbers tell the story — but understanding tells the wisdom.


Leave a Reply