

💡 Introduction: Why Valuation Metrics Matter
In the world of stock investing, price movements may catch your eye, but value is what truly matters.
Professional investors don’t just buy shares — they evaluate companies based on their financial strength and intrinsic worth.
Three of the most crucial tools in this evaluation are:
👉 P/E Ratio (Price-to-Earnings)
👉 EPS (Earnings Per Share)
👉 Book Value
These aren’t just numbers — they are windows into a company’s financial reality.
Understanding them helps you decide whether a stock is overvalued, undervalued, or fairly priced — a key to long-term wealth creation.
📘 1. What Is the P/E Ratio (Price-to-Earnings Ratio)?
🧾 Definition:
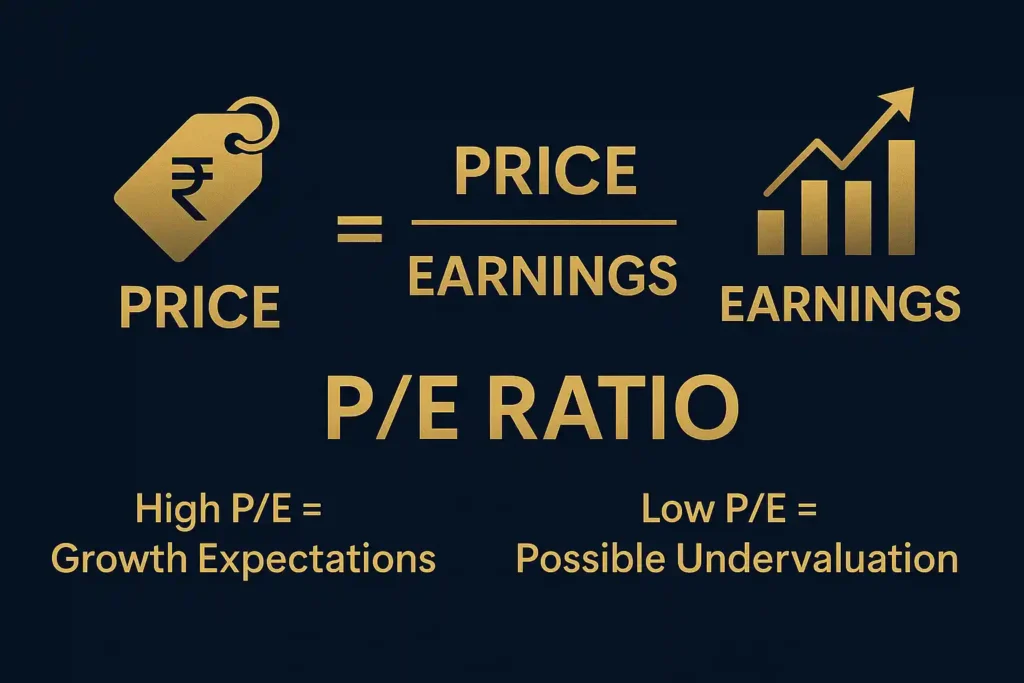
The P/E Ratio compares a company’s current share price to its earnings per share (EPS).
Formula:
P/E Ratio = Market Price per Share ÷ Earnings Per Share (EPS)
This metric shows how much investors are willing to pay for ₹1 of the company’s earnings.
📊 Example:
If a company’s share price is ₹500 and its EPS is ₹25,
P/E = 500 ÷ 25 = 20
This means investors are paying ₹20 for every ₹1 of profit the company generates.
🧩 Interpretation:
| P/E Ratio Range | Meaning |
|---|---|
| High P/E (>25) | Market expects high growth or the stock might be overvalued |
| Moderate P/E (15–25) | Reasonable valuation for growth stocks |
| Low P/E (<15) | Possibly undervalued or low-growth company |
⚠️ A very high P/E may indicate hype, while a very low P/E may signal hidden risk or poor earnings growth.
💬 Investor Insight:
- Compare a company’s P/E with industry peers — not in isolation.
- A high P/E for a technology firm might be normal, but not for a cement company.
- Look at the PEG Ratio (P/E ÷ Growth) for deeper understanding.
💰 2. What Is EPS (Earnings Per Share)?
🧾 Definition:
Earnings Per Share (EPS) shows how much profit the company makes for each outstanding share.
Formula:
EPS = Net Profit ÷ Number of Outstanding Shares
It’s one of the most important indicators of a company’s profitability.
📊 Example:
If a company earns ₹100 crore in net profit and has 10 crore shares outstanding:
EPS = ₹100 crore ÷ 10 crore = ₹10 per share
This means each share earned ₹10 in profit during the period.
🧩 Why EPS Matters:

- A rising EPS trend indicates consistent growth and good management.
- A declining EPS warns of slowing profits or growing expenses.
- EPS is the foundation for ratios like P/E and Price-to-Book.
💬 Pro Tip:
Always compare EPS growth over multiple years, not just one quarter.
Steady growth = stability. Sudden spikes or drops = volatility risk.
🏦 3. What Is Book Value?

🧾 Definition:
Book Value represents the net worth of a company per share, based on its financial records.
Formula:
Book Value per Share = (Total Assets – Total Liabilities) ÷ Total Outstanding Shares
It tells you what each share would be worth if the company were liquidated today.
📊 Example:
If a company has ₹1000 crore in assets and ₹400 crore in liabilities, with 10 crore shares:
Book Value = (₹1000 – ₹400) ÷ 10 = ₹60 per share
If the stock is trading at ₹120, the Price-to-Book Ratio (P/B) = 120 ÷ 60 = 2.0.
💬 Interpretation:
| Metric | Meaning |
|---|---|
| High Book Value Growth | Strong asset base, efficient reinvestment |
| Low Book Value or Negative | Excessive liabilities or weak equity |
| Price < Book Value | Undervalued stock opportunity |
| Price > Book Value | Market pricing in future growth |
💬 Pro Tip:
Use Book Value along with Return on Equity (ROE) — a company that grows book value steadily while maintaining a high ROE is often a long-term winner.
📈 4. How P/E, EPS, and Book Value Work Together
| Metric | What It Tells You | Ideal For |
|---|---|---|
| EPS | Measures company’s profitability | Earnings growth tracking |
| P/E Ratio | Shows how the market values those earnings | Stock valuation |
| Book Value | Reflects the company’s real net worth | Long-term financial health |
Together, they form the core of fundamental analysis.
Example:
Let’s take a simple company snapshot 👇
| Metric | Value |
|---|---|
| Share Price | ₹200 |
| EPS | ₹10 |
| P/E Ratio | 20 |
| Book Value | ₹120 |
Here’s what it means:
- Investors are paying 20× earnings (P/E = 20).
- The company has strong assets (Book Value ₹120).
- If it keeps growing EPS, the price will justify or exceed current valuation.
💼 5. Using These Metrics in Real-World Investing
✅ Step 1: Compare with Peers
Example: Compare Infosys, TCS, and Wipro’s P/E, EPS, and Book Value to identify the most efficient and fairly priced company.
✅ Step 2: Check Historical Trends
Look for consistent EPS and Book Value growth — it indicates solid fundamentals.
✅ Step 3: Avoid Emotional Decisions
Never buy just because “P/E is low.” Always combine it with earnings quality, debt levels, and cash flow.
🧠 6. Real Example (Infosys Ltd.)
| Metric (2024) | Value |
|---|---|
| EPS | ₹59.5 |
| P/E Ratio | 25.8 |
| Book Value | ₹230 per share |
Interpretation:
✅ Infosys shows consistent earnings and moderate P/E.
✅ The market expects steady growth (fairly valued).
✅ The Book Value indicates a strong balance sheet.
📊 7. Red Flags to Watch Out For
🚩 Rapidly Increasing P/E without EPS growth → Overvaluation risk.
🚩 Falling EPS while price stays high → Bubble signal.
🚩 Book Value Shrinking → Excessive debt or poor reinvestment.
💬 8. Golden Rule for Investors
“EPS shows performance.
P/E shows perception.
Book Value shows foundation.”
Smart investors analyze all three — not just one — to identify true value stocks and avoid emotional trading.
📘 Conclusion: The Trio of True Value
Understanding P/E, EPS, and Book Value transforms you from a casual buyer into a strategic investor.
These three metrics, when analyzed together, reveal:
✅ How profitable a company is (EPS)
✅ How the market values that profit (P/E)
✅ How financially strong the business really is (Book Value)
The next time you research a stock — look beyond the price chart.
Study the numbers that define real worth — because markets may fluctuate, but value always prevails.


Leave a Reply