
Moving averages (MA) are among the most trusted technical indicators in the stock market. Whether you’re an intraday trader, swing trader, or long-term investor, understanding moving averages helps you identify trend direction, entry opportunities, exit points, support-resistance zones, and market momentum.
This guide explains moving averages in a simple, practical, human-friendly way — using real examples, charts, and everyday scenarios to make everything easy and actionable.
📌 What Are Moving Averages? (Simple Explanation)
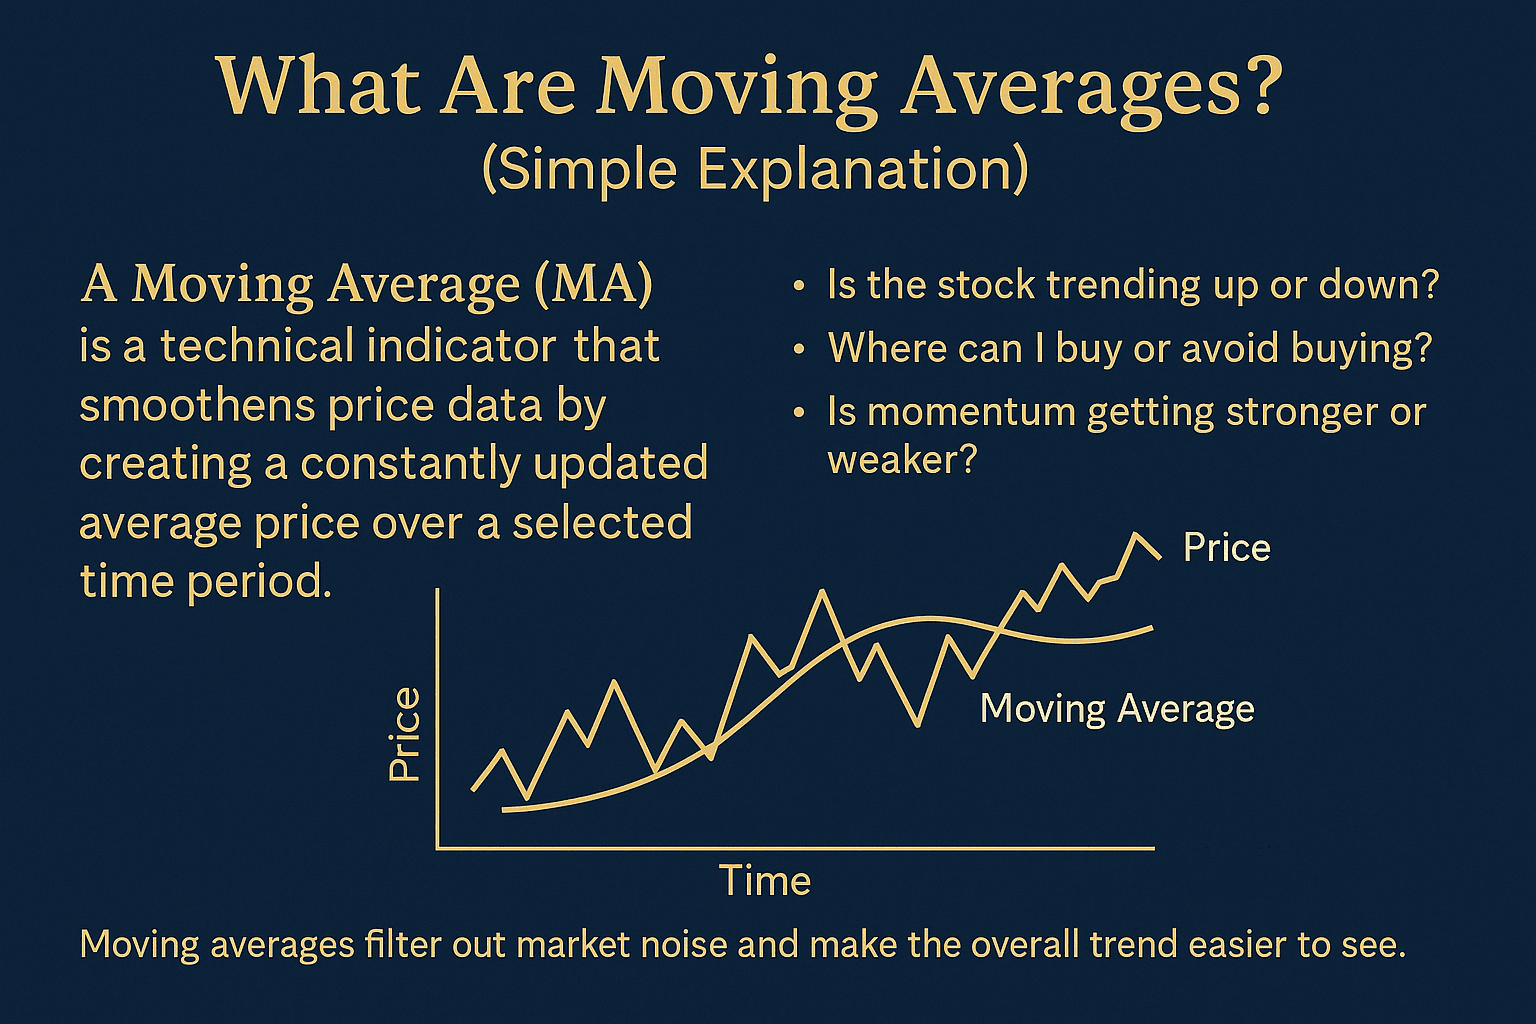
A Moving Average (MA) is a technical indicator that smoothens price data by creating a constantly updated average price over a selected time period.
It helps traders answer questions like:
- Is the stock trending up or down?
- Is momentum getting stronger or weaker?
- Where can I buy with low risk?
- Where should I avoid buying?
Moving averages filter out market noise and make the overall trend easier to see.
✅ Types of Moving Averages
There are many types, but the market mostly uses these three:
1️⃣ Simple Moving Average (SMA)
The Simple Moving Average calculates the average closing price over a defined time period.
✨ Example:
A 20-Day SMA adds the closing prices of the last 20 days and divides by 20.
✔ What SMA Shows:
- Trend direction
- Support & resistance levels
- Long-term stability
📉 Real-Market Example:
If Reliance (RELIANCE.NS) is trading above the 50-SMA, it usually indicates a strong uptrend. If it breaks below the 50-SMA, the trend may turn weak.
2️⃣ Exponential Moving Average (EMA)
EMA gives more weight to recent prices, making it faster and more responsive than SMA.
✨ Example:
In intraday trading, the 9-EMA and 21-EMA are widely used for spotting trend shifts.
✔ What EMA Shows:
- Quick momentum change
- Fast signals for entries/exits
- Ideal for intraday & swing trading
📉 Real-Market Example:
Bank Nifty often uses 9-EMA as a support during bullish rallies. When it closes below the 9-EMA, a correction usually follows.
3️⃣ Weighted Moving Average (WMA)
WMA assigns weight to each price point — the most recent price gets the highest weight.
✔ When to Use:
- When price changes fast
- When you want sensitivity + accuracy
🚀 Why Moving Averages Are Important
Moving averages help you:
✔ Identify the Trend
“Trend is your friend.”
MAs clearly show whether the trend is UP, DOWN, or SIDEWAYS.
✔ Spot Support & Resistance
Moving averages often act as dynamic support and resistance.
Example:
- 50-SMA → Medium-term support
- 200-SMA → Long-term institutional support
✔ Generate Buy & Sell Signals
Moving averages give clean trading signals:
- Price crossing above MA → Buy
- Price crossing below MA → Sell
✔ Avoid Fake Breakouts
Traders use EMA/SMA to confirm whether a breakout is real or trap.
🔥 Popular Moving Average Strategies (With Examples)
⭐ Strategy 1: Moving Average Crossover Strategy
This occurs when a fast MA crosses a slow MA.
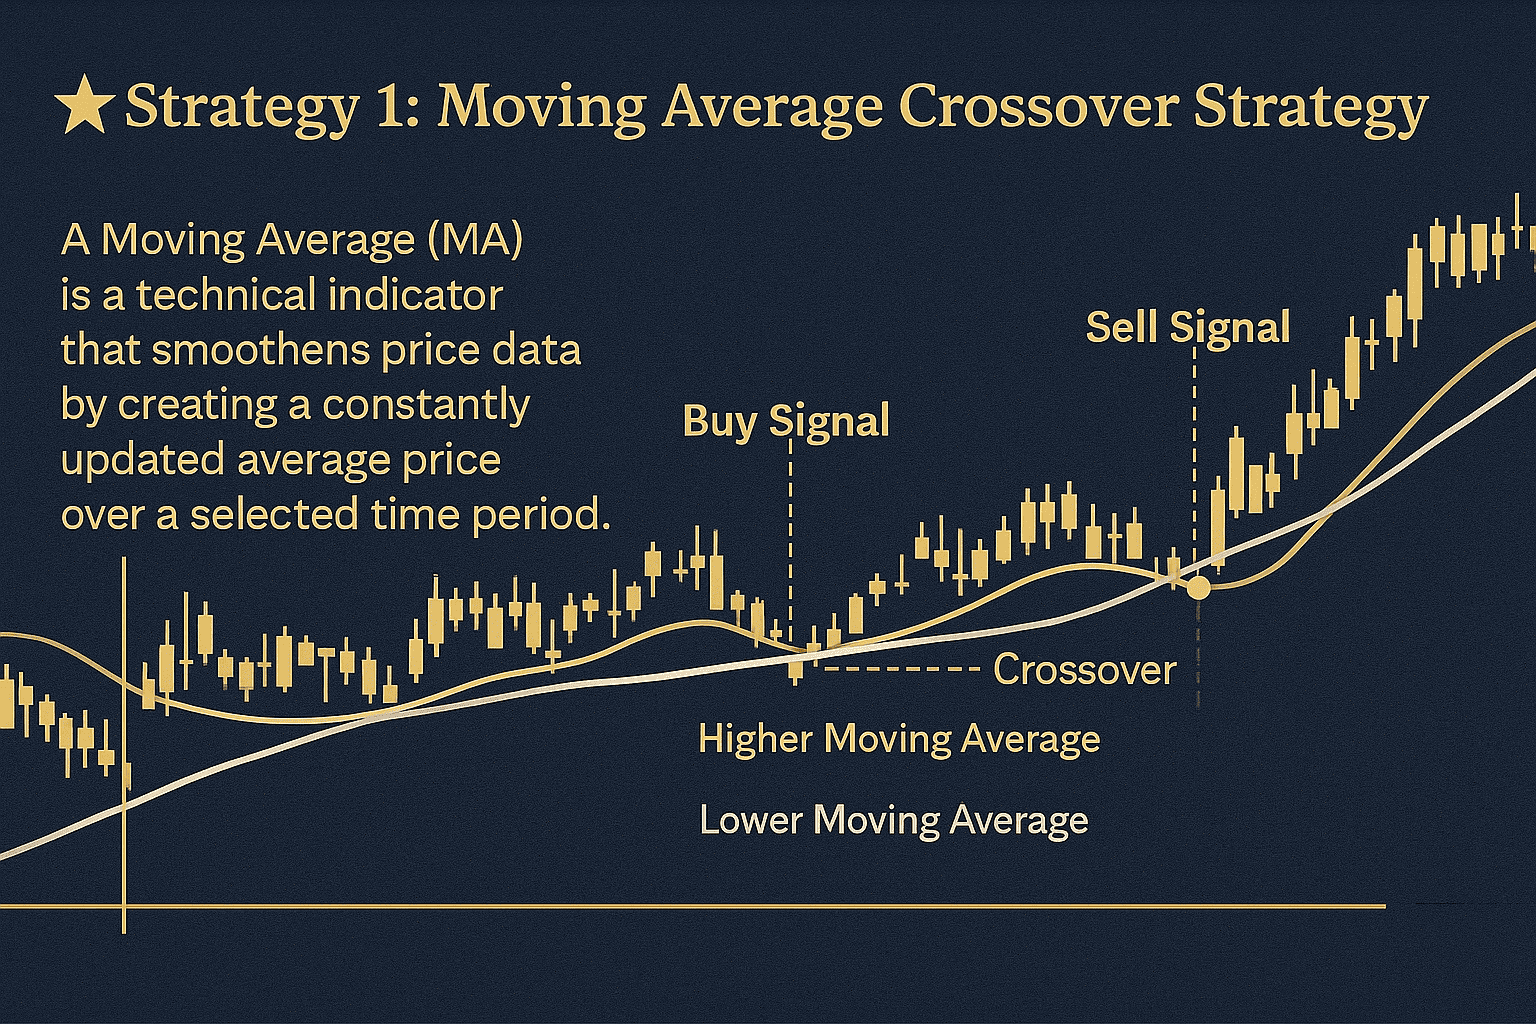
✔ Best Timeframes:
- Intraday: 9-EMA & 21-EMA
- Swing Trading: 20-SMA & 50-SMA
- Long-Term: 50-SMA & 200-SMA
📉 Example:
Golden Cross
50-SMA crosses above 200-SMA → Strong long-term buy signal.
Death Cross
50-SMA crosses below 200-SMA → Strong bearish signal.
⭐ Strategy 2: 9 EMA Pullback Strategy (Intraday King)
This is the most powerful intraday strategy used by pros.
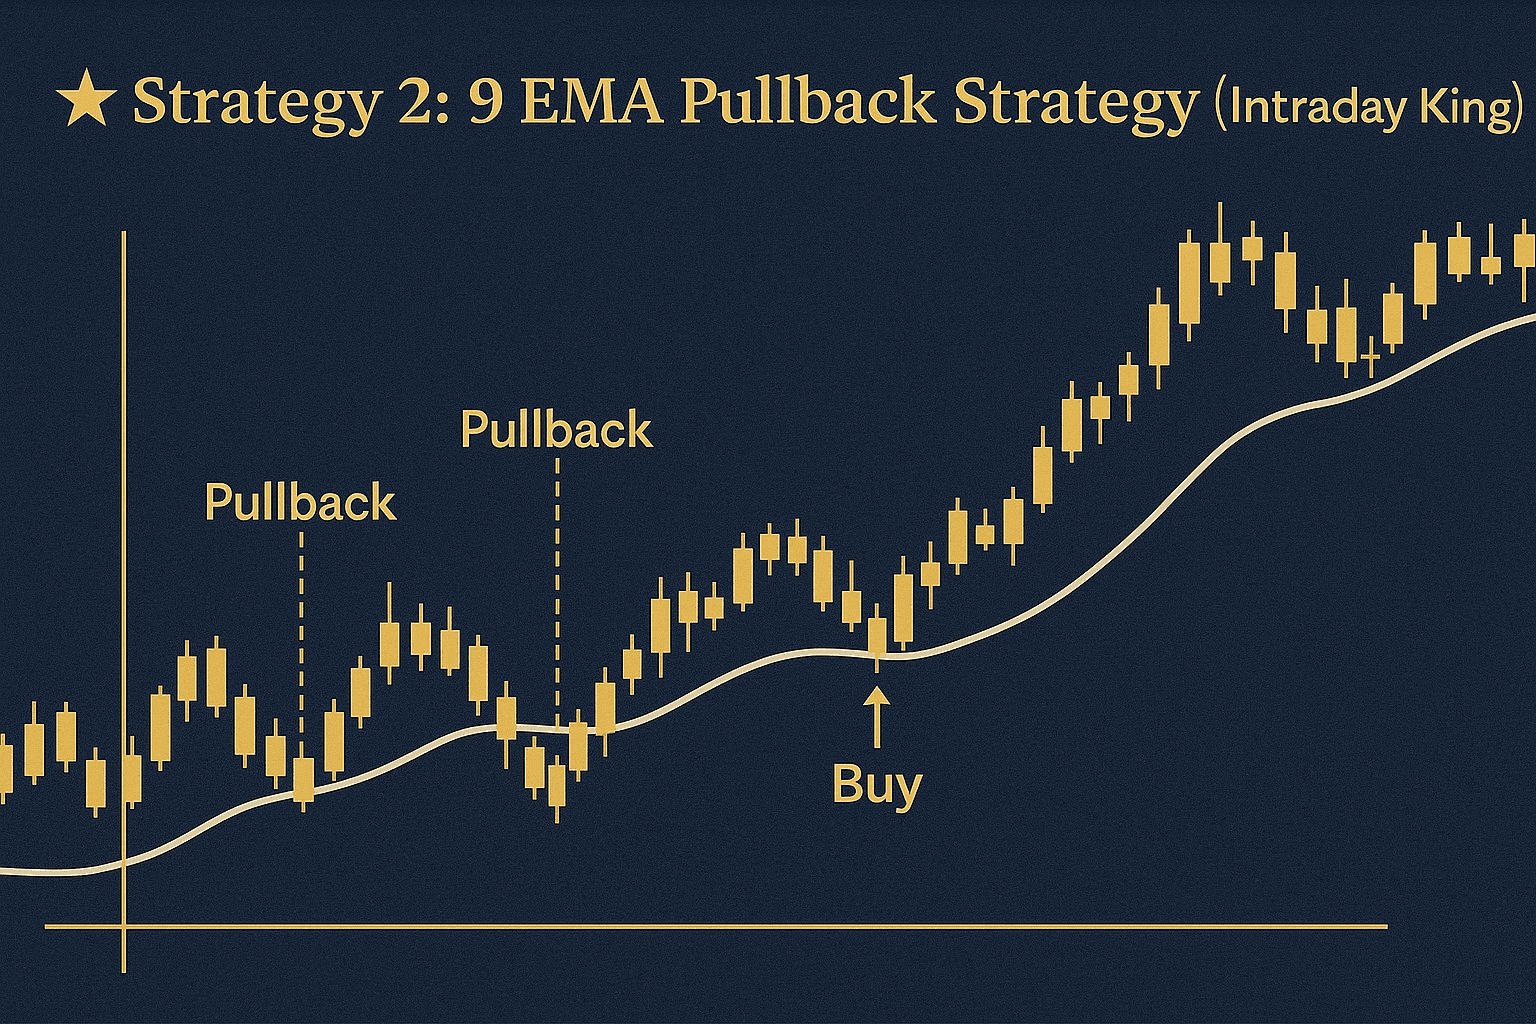
How it works:
- Identify uptrend using 21-EMA.
- Wait for price to pull back to 9-EMA.
- Enter on bullish candle formation.
Example:
Bank Nifty rallies strongly when respecting 9-EMA on 5-min chart.
⭐ Strategy 3: 200-SMA Trend Filter
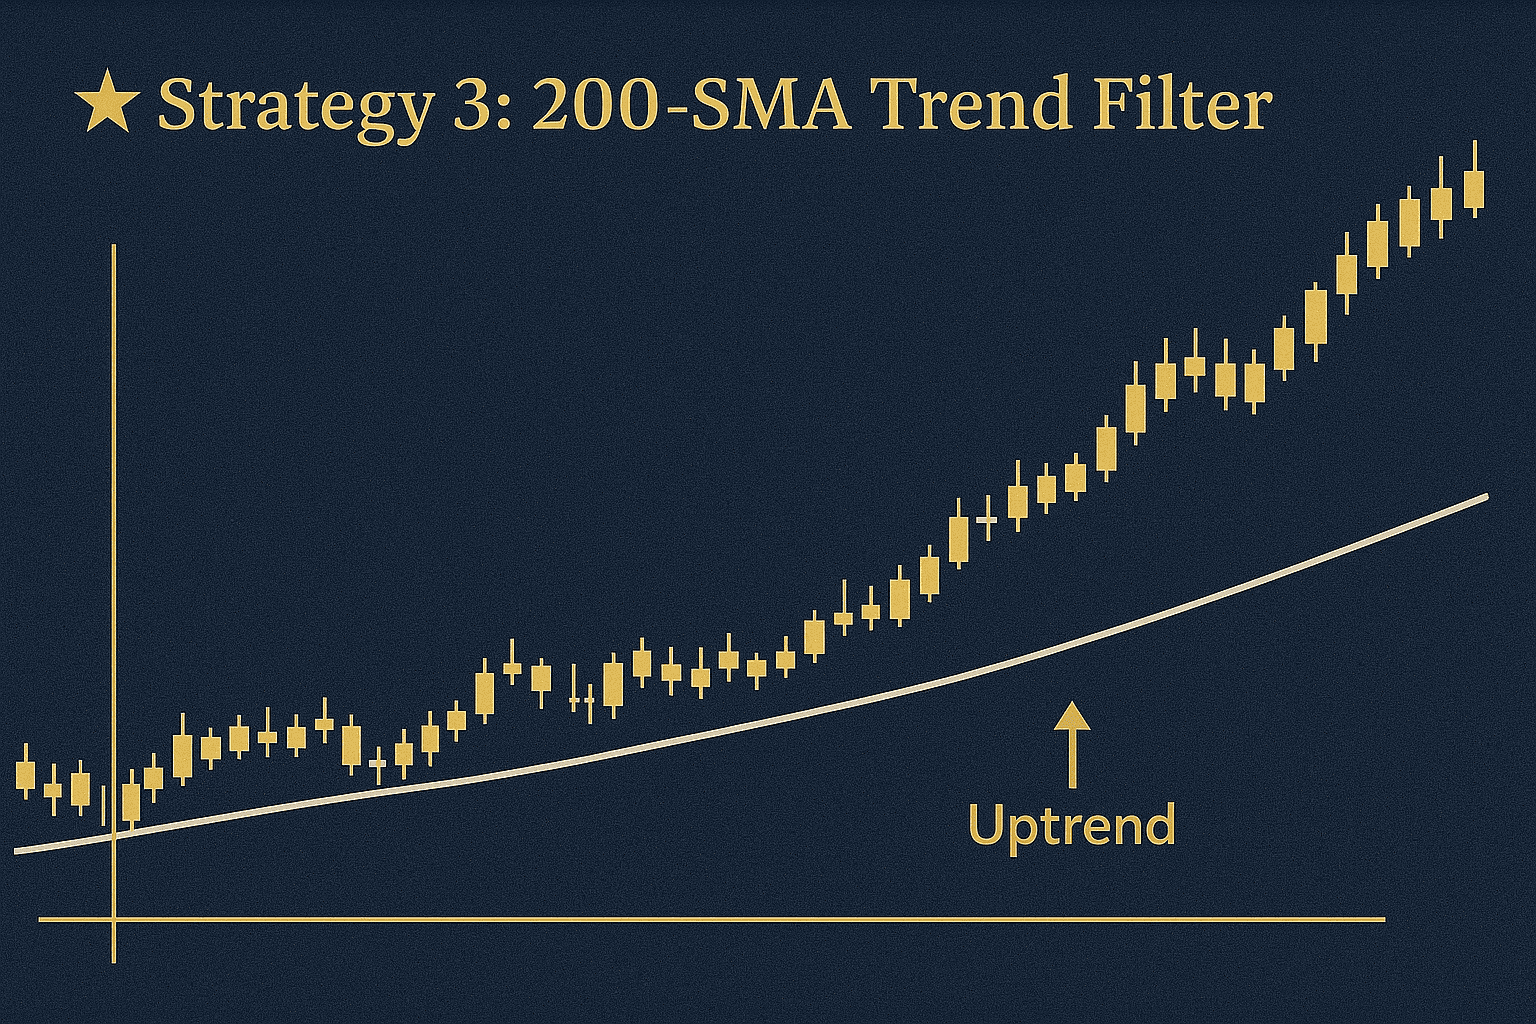
Institutions and mutual funds track the 200-SMA.
✔ Rules:
- Price above 200-SMA → Only long trades
- Price below 200-SMA → Only short trades
Example:
NIFTY 50 usually stays above 200-SMA during bull markets.
⭐ Strategy 4: Dynamic Support & Resistance Strategy
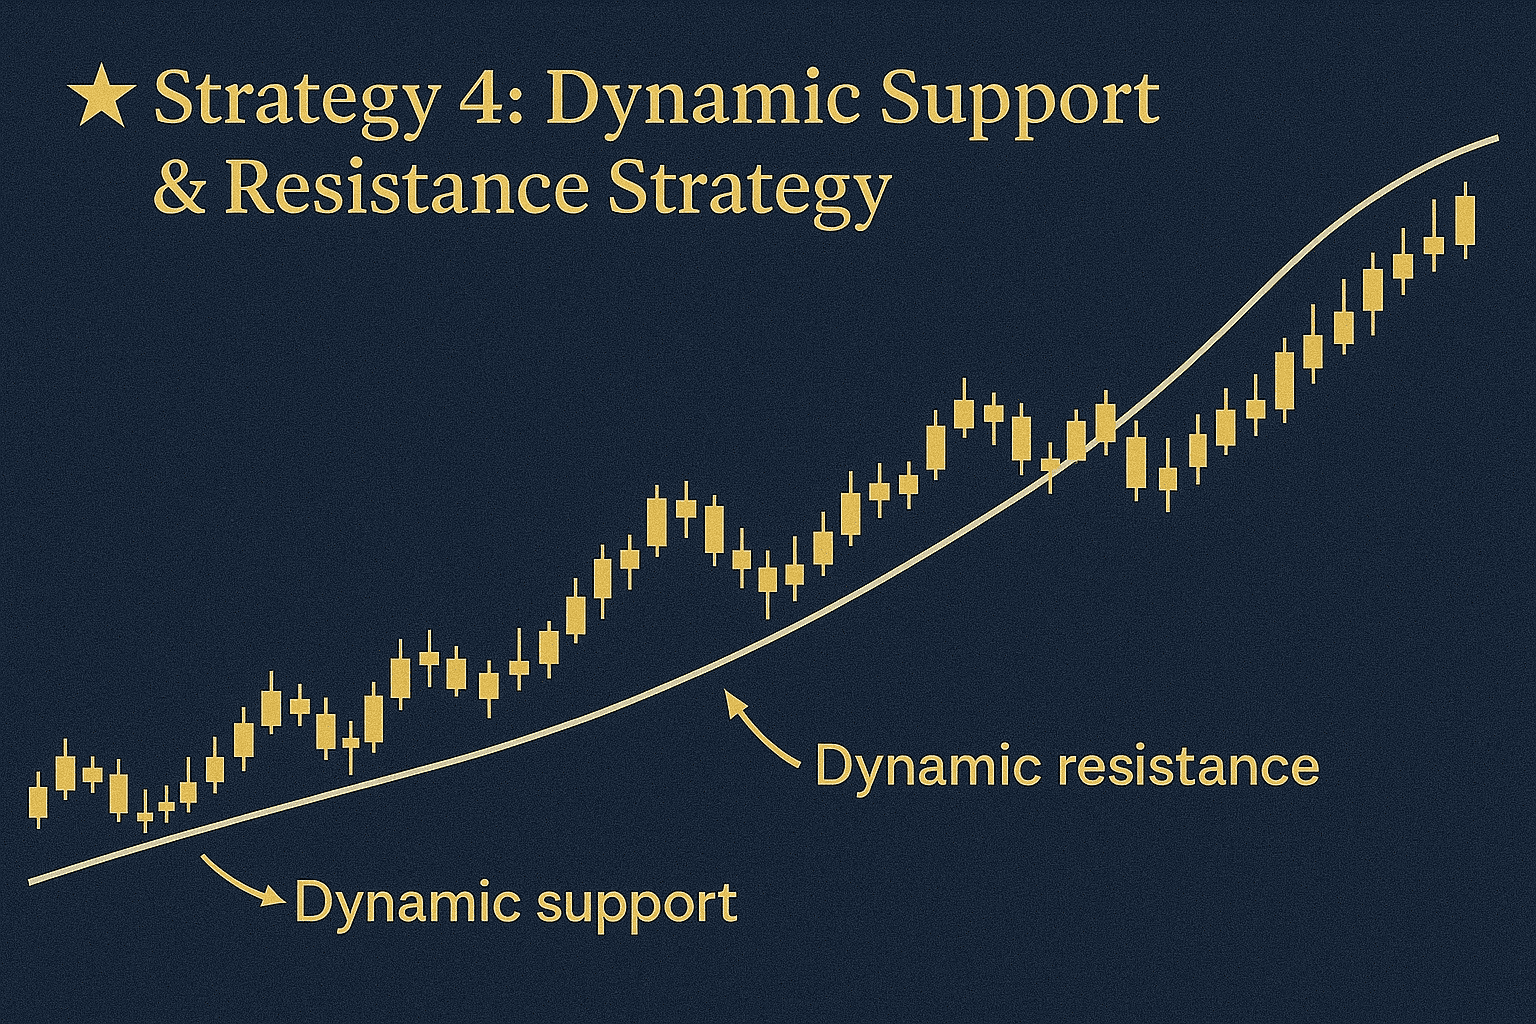
Price respects EMAs as support or resistance.
Example:
- Tata Motors taking support at 20-EMA, bouncing higher multiple times.
- HDFC Bank rejecting resistance at 50-EMA.
📊 Real-Life Market Examples
📍 Example 1: NIFTY 50 Trend Reversal Using 50-SMA
When NIFTY closes above 50-SMA after a correction, a strong reversal often begins.
📍 Example 2: Reliance Using 200-SMA
Reliance tends to bounce near its 200-Day SMA, indicating institutions are accumulating.
📍 Example 3: Intraday Example with EMA
BankNifty respecting 9-EMA during high-momentum trends on the 5-min chart.
🧠 How to Choose the Right Moving Average
| Trader Type | Best MA | Best Use |
|---|---|---|
| Intraday | 9-EMA, 21-EMA | Quick trend, pullbacks |
| Swing Trader | 20-SMA, 50-SMA | Trend direction |
| Long Term | 100-SMA, 200-SMA | Major trend filter |
| Option Trader | 9-EMA, 21-EMA | Momentum shifts |
❗ Common Mistakes Traders Make with Moving Averages
❌ Using too many MAs
Leads to confusion — keep it simple.
❌ Not combining with price action
MA alone isn’t enough — use candlesticks too.
❌ Blindly entering on every crossover
Look for trend confirmation.
❌ Ignoring higher timeframes
Always check the trend on bigger charts.
🌟 Best Settings for Moving Averages
✔ For Intraday:
- 9-EMA
- 21-EMA
- 50-EMA
✔ For Swing:
- 20-SMA
- 50-SMA
- 100-SMA
✔ For Positional & Long-Term:
- 100-SMA
- 200-SMA
✔ For Confirmation:
Use 200-SMA as the backbone of trend direction.
🧠 Do Moving Averages Work in All Markets?
Yes, but better in:
- Trending markets
- Volatile phases
- Stocks with high liquidity
Not effective in:
- Sideways markets
- Low-volume stocks
- Choppy phases
🏁 Conclusion: Why Moving Averages Are Essential for Traders
Moving averages help you:
- Understand market trend clearly
- Avoid bad trades
- Identify low-risk entries
- Catch big moves early
- Stay aligned with smart money
Whether you trade stocks, indices, forex, or crypto — moving averages are simple but extremely powerful tools.
If you combine EMAs/SMAs with proper price action (candlesticks, support/resistance), your trading accuracy increases drastically.


Leave a Reply