
Candlestick patterns are the visual language of the stock market. They reveal the hidden emotions of buyers and sellers—fear, greed, strength, weakness—and help traders anticipate potential price movements. Whether you’re a beginner or an experienced trader, understanding candlestick patterns is one of the most valuable skills you can develop for consistent success in the stock market.
In this comprehensive guide, we will explore the most powerful and reliable candlestick patterns every trader should know, how they work, when to use them, and how to avoid common mistakes while reading them.
What Are Candlestick Patterns?
Candlestick patterns are visual representations of price data for a given period. Each candlestick displays four key components:
- Open
- High
- Low
- Close
These candlesticks, when combined over multiple sessions, form patterns that can indicate whether buyers or sellers have control—and what might happen next.
Candlestick patterns are divided mainly into:
- Bullish reversal patterns
- Bearish reversal patterns
- Trend continuation patterns
- Indecision patterns
Let’s explore the most important ones.
1. Bullish Candlestick Patterns
1.1 Hammer
A hammer appears at the bottom of a downtrend, signaling that buyers are stepping in.

How it works
- Long lower wick showing sellers pushed prices down
- Strong buying pushed price back near the open
- Indicates a potential reversal to the upside
When to use
Hammer + high volume + support zone = strong bullish indication.
1.2 Bullish Engulfing
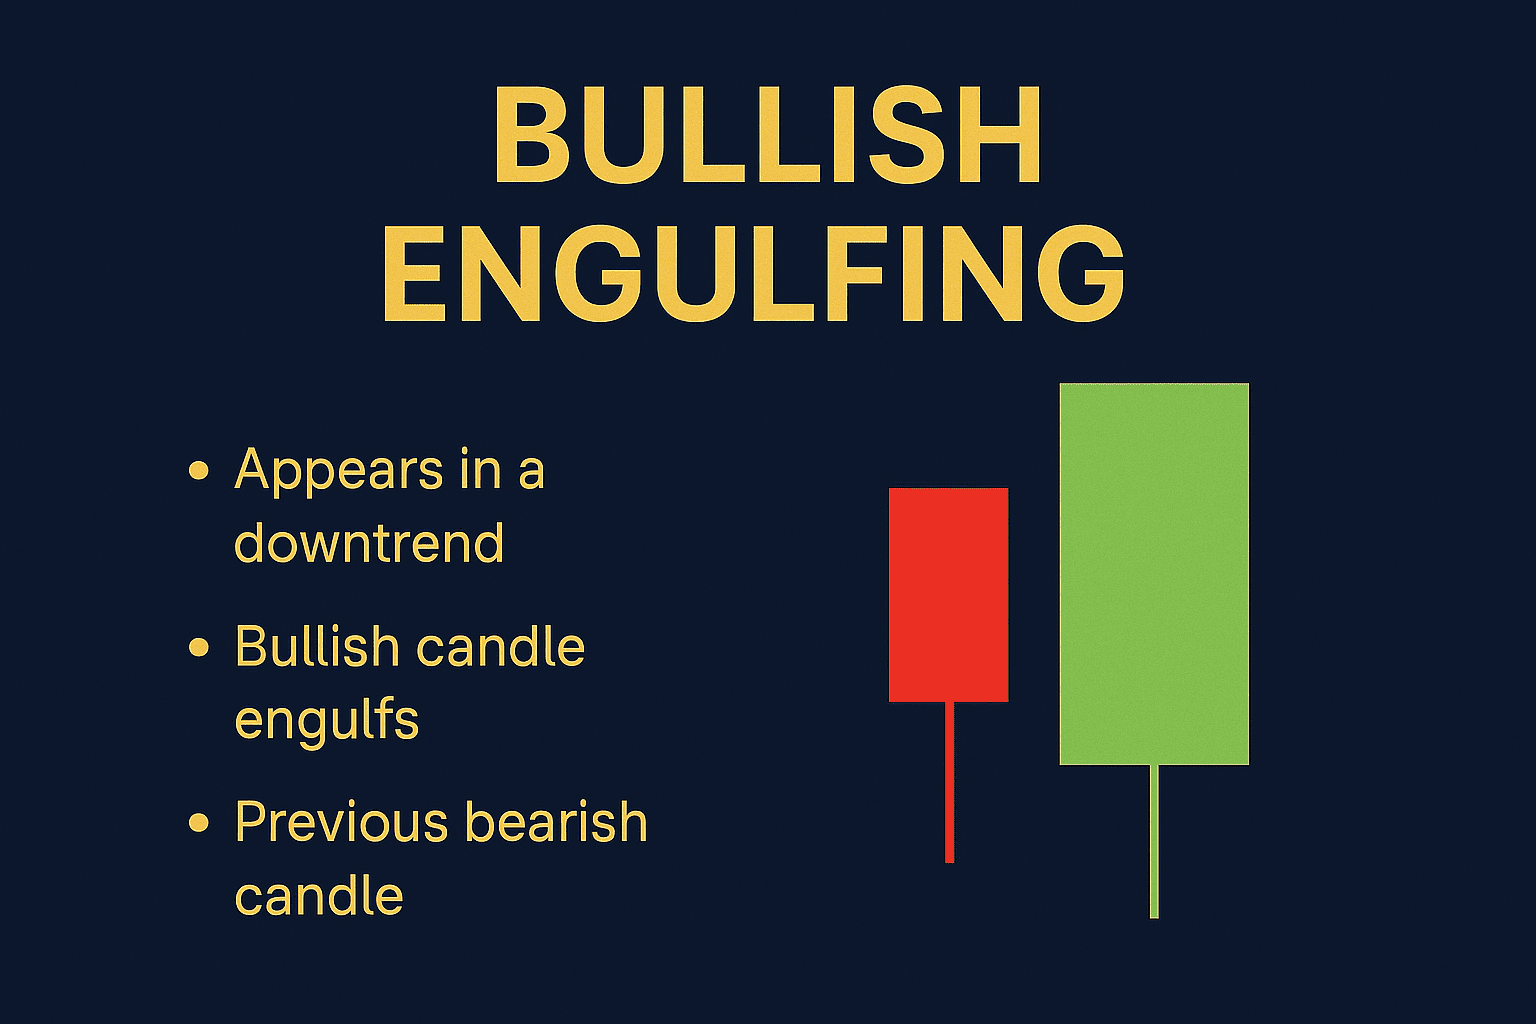
A powerful reversal pattern showing strong buying pressure.
Features
- A small red candle followed by a larger green candle
- The green candle completely engulfs the previous red body
- Indicates buyers have overpowered sellers
Best place to trade
At the bottom of a downtrend or key demand zone.
1.3 Morning Star
A three-candle bullish reversal signal.

Structure
- Large bearish candle
- Small indecision candle (Doji/Spinning Top)
- Large bullish candle closing above the midpoint of Candle 1
Meaning
Indicates selling pressure is fading and buying pressure is increasing.
2. Bearish Candlestick Patterns
2.1 Shooting Star
A bearish pattern formed at the top of an uptrend.

Characteristics
- Long upper wick
- Small body near the bottom
- Shows buyers tried to push price up but failed
Signal
Reversal to downside likely.
2.2 Bearish Engulfing
The opposite of bullish engulfing.
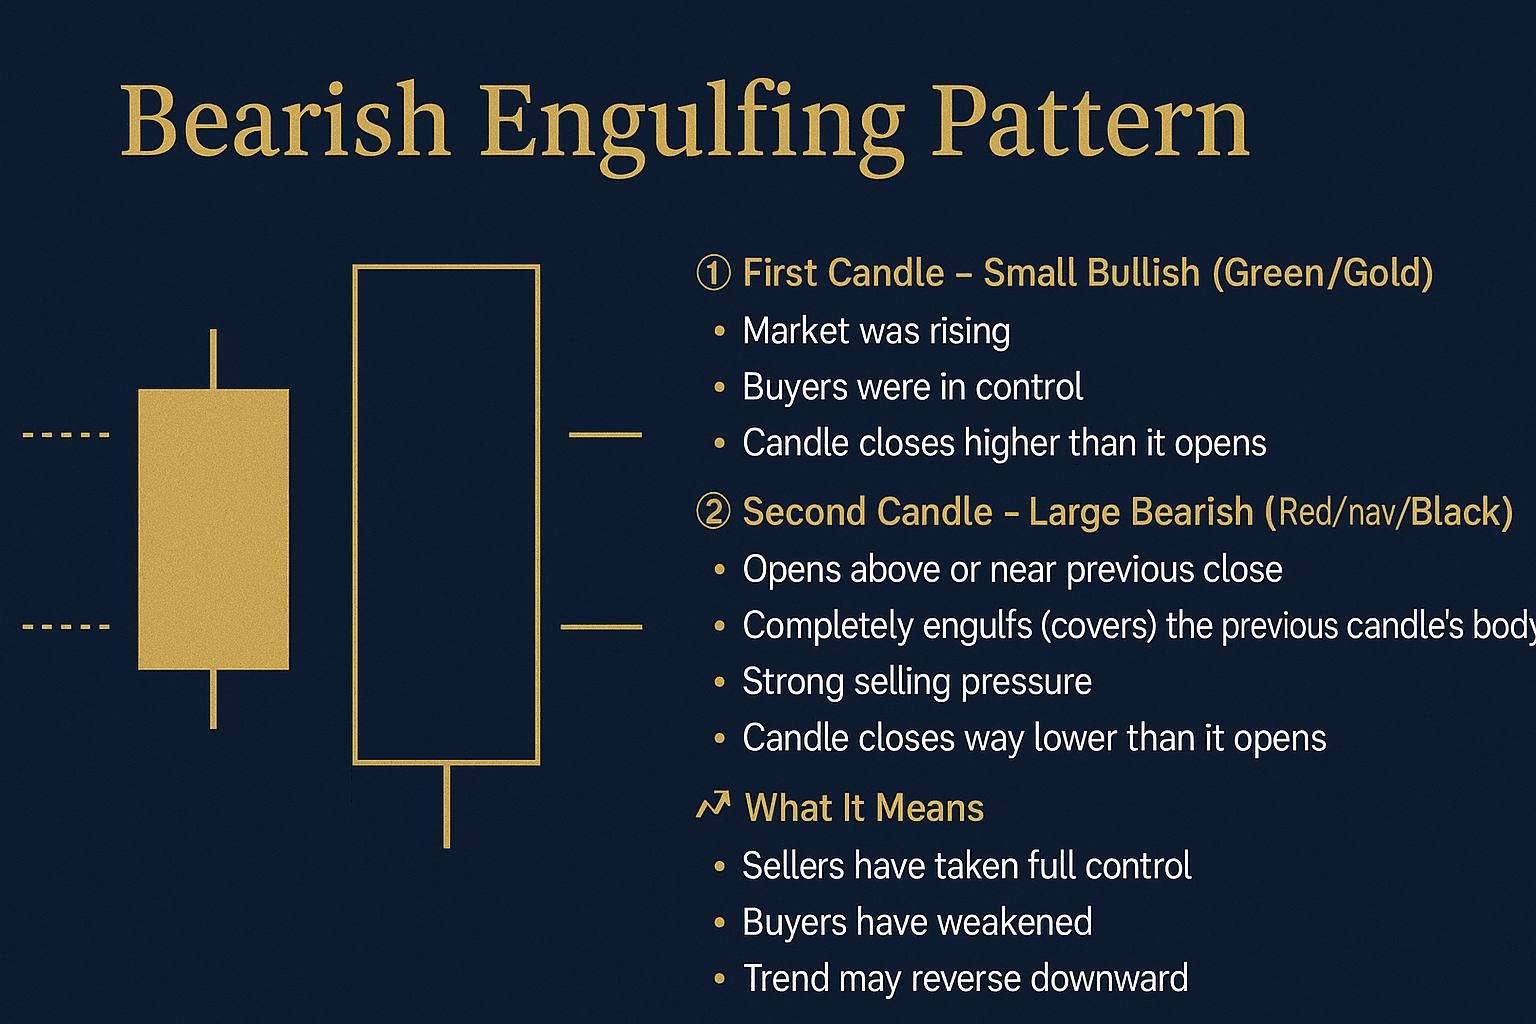
Explanation
- Small green candle followed by a large red candle
- Red candle engulfs green completely
- Sellers take full control
Best use case
When it forms near resistance or after a sharp uptrend.
2.3 Evening Star
The opposite of the morning star pattern.
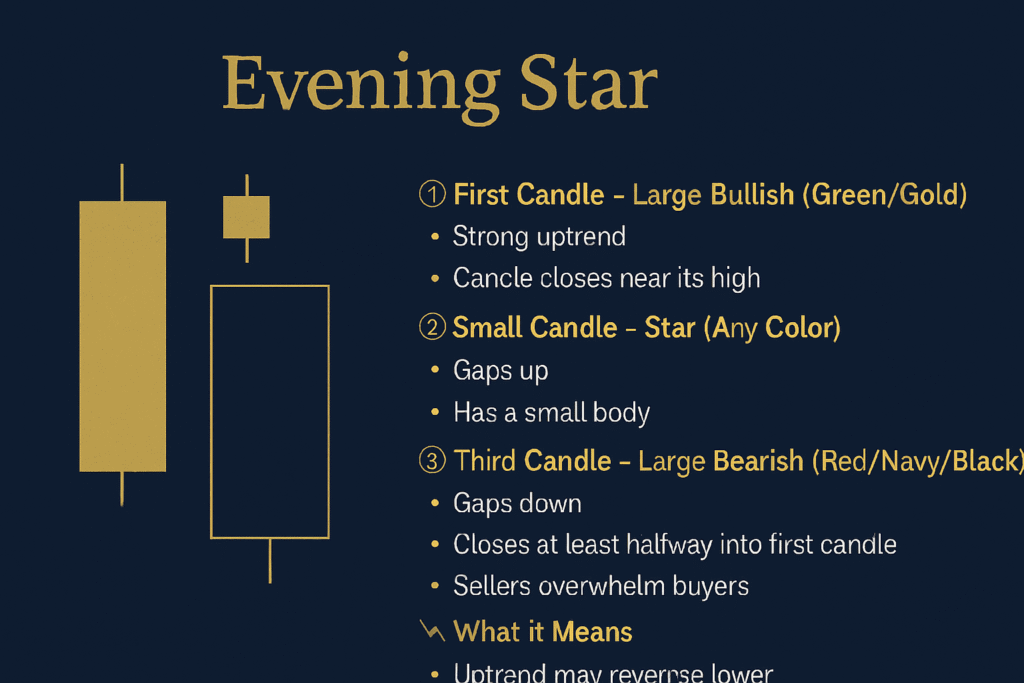
Formation
- Strong bullish candle
- Indecision candle at top
- Strong bearish candle closing below mid of Candle 1
Interpretation
A shift from buying pressure to strong selling.
3. Indecision Candlestick Patterns
Indecision patterns show that neither buyers nor sellers have complete control.
3.1 Doji
A Doji has nearly the same open and close price.
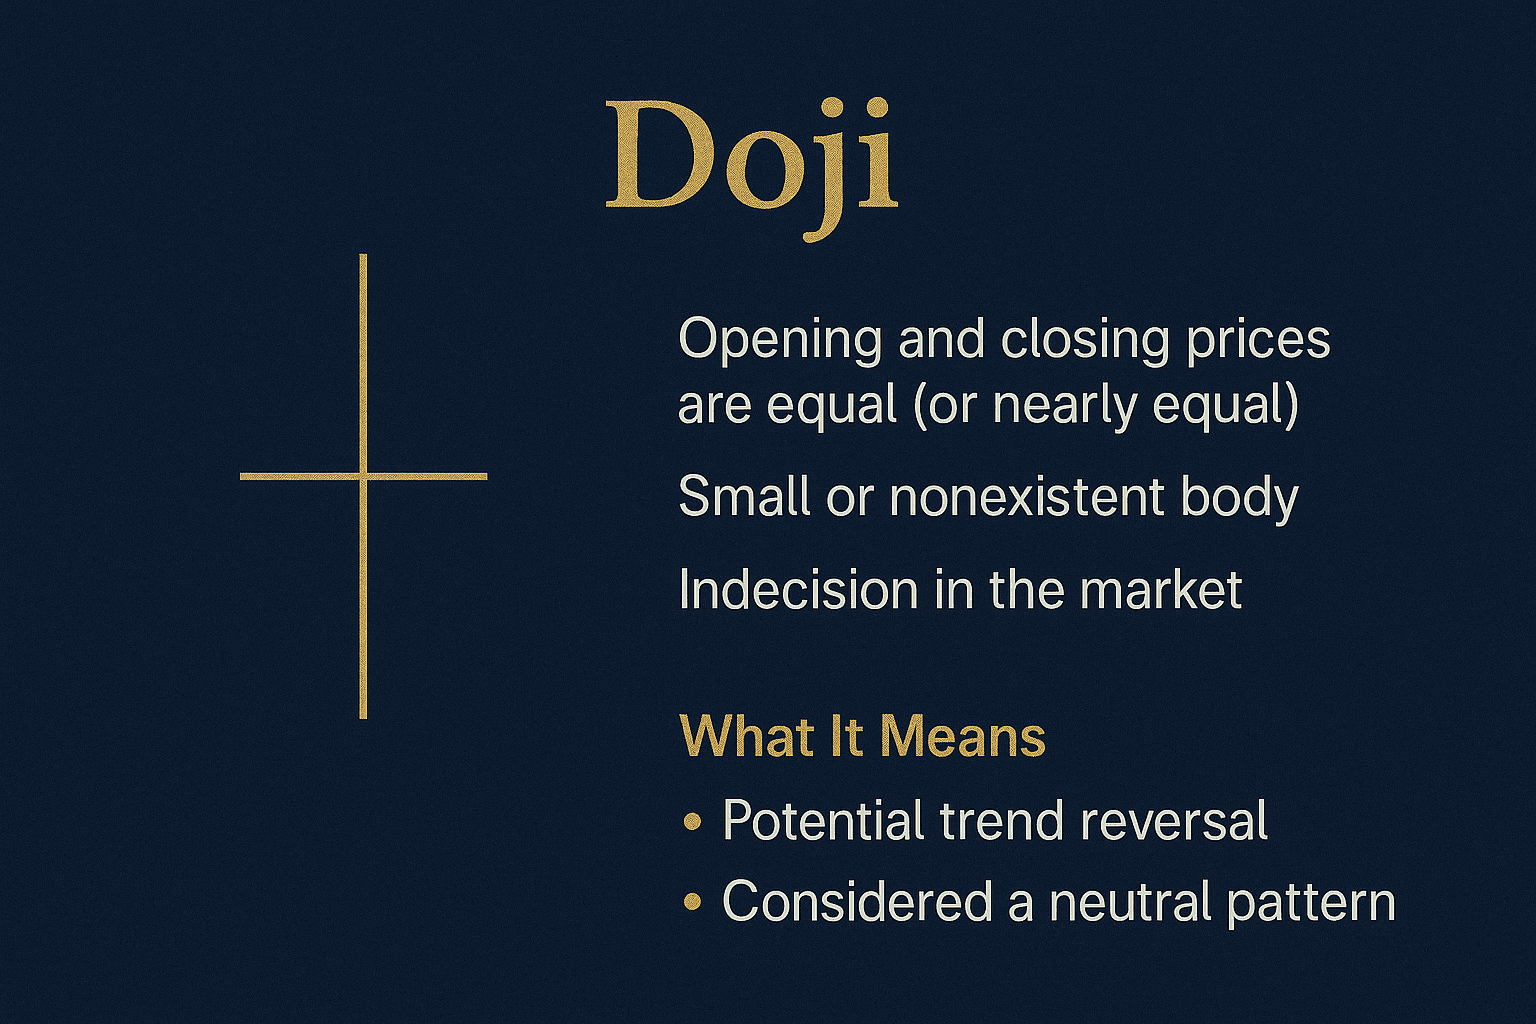
What it indicates
- Market uncertainty
- Possible trend reversal if formed at extremes
Common types
- Standard Doji
- Dragonfly Doji
- Gravestone Doji
Each has its own implications depending on wick length.
3.2 Spinning Top
Small body with upper and lower shadows.
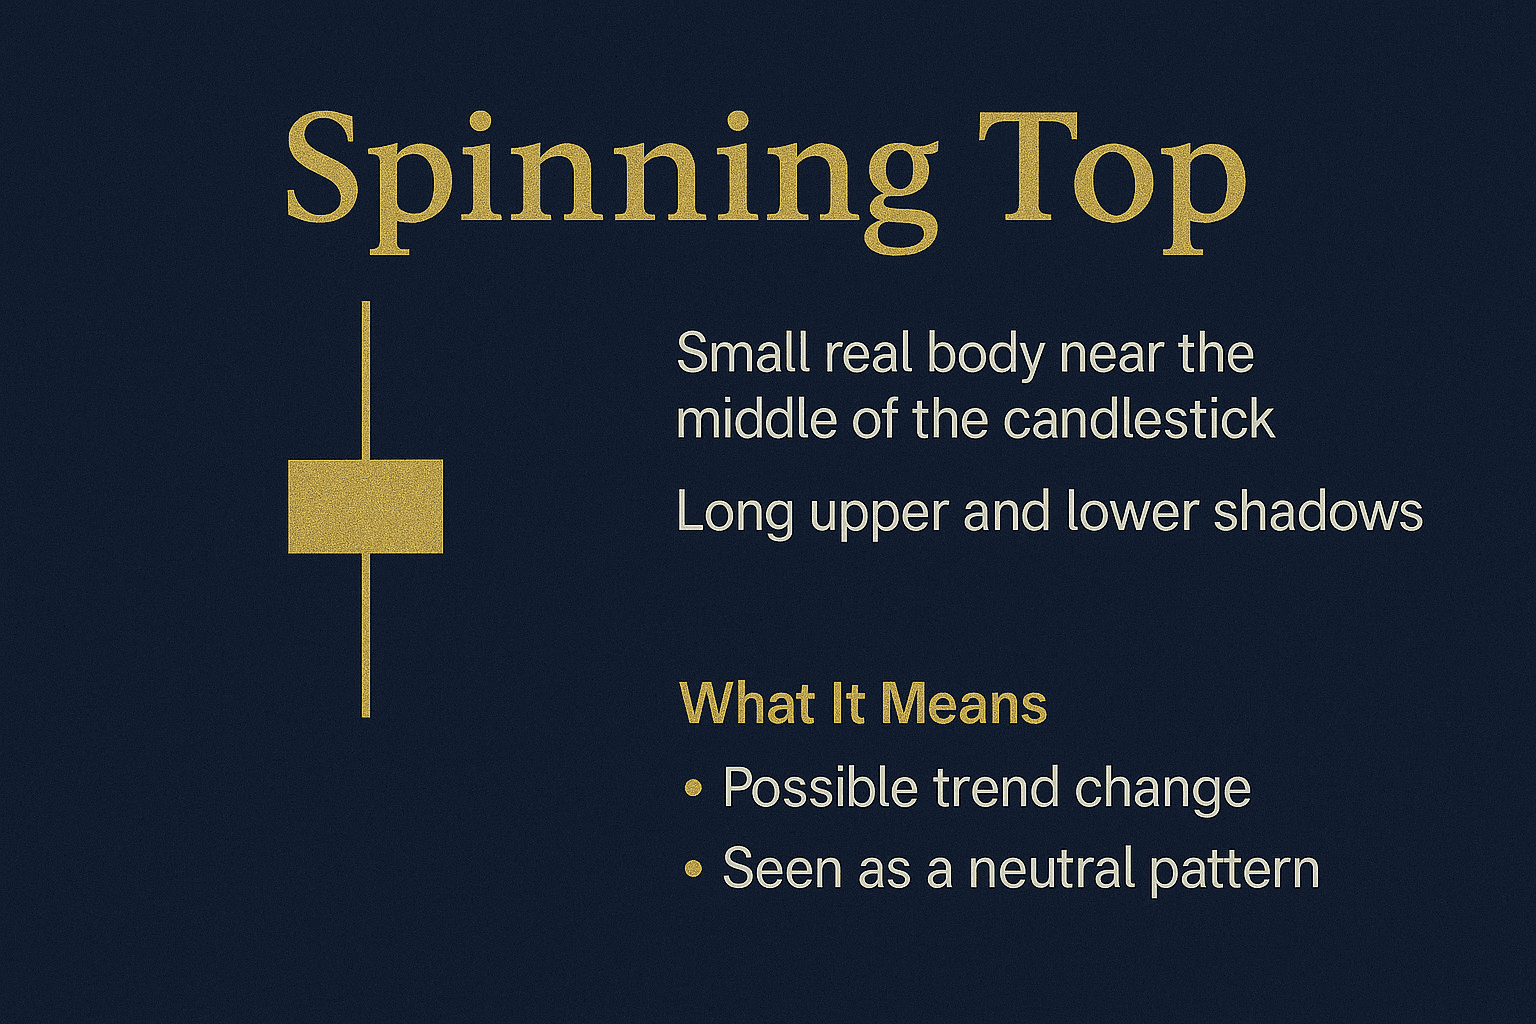
Meaning
- Buyers and sellers are battling
- Market may be preparing for a trend change
3.3 Inside Bar
A candlestick fully inside the previous candle.
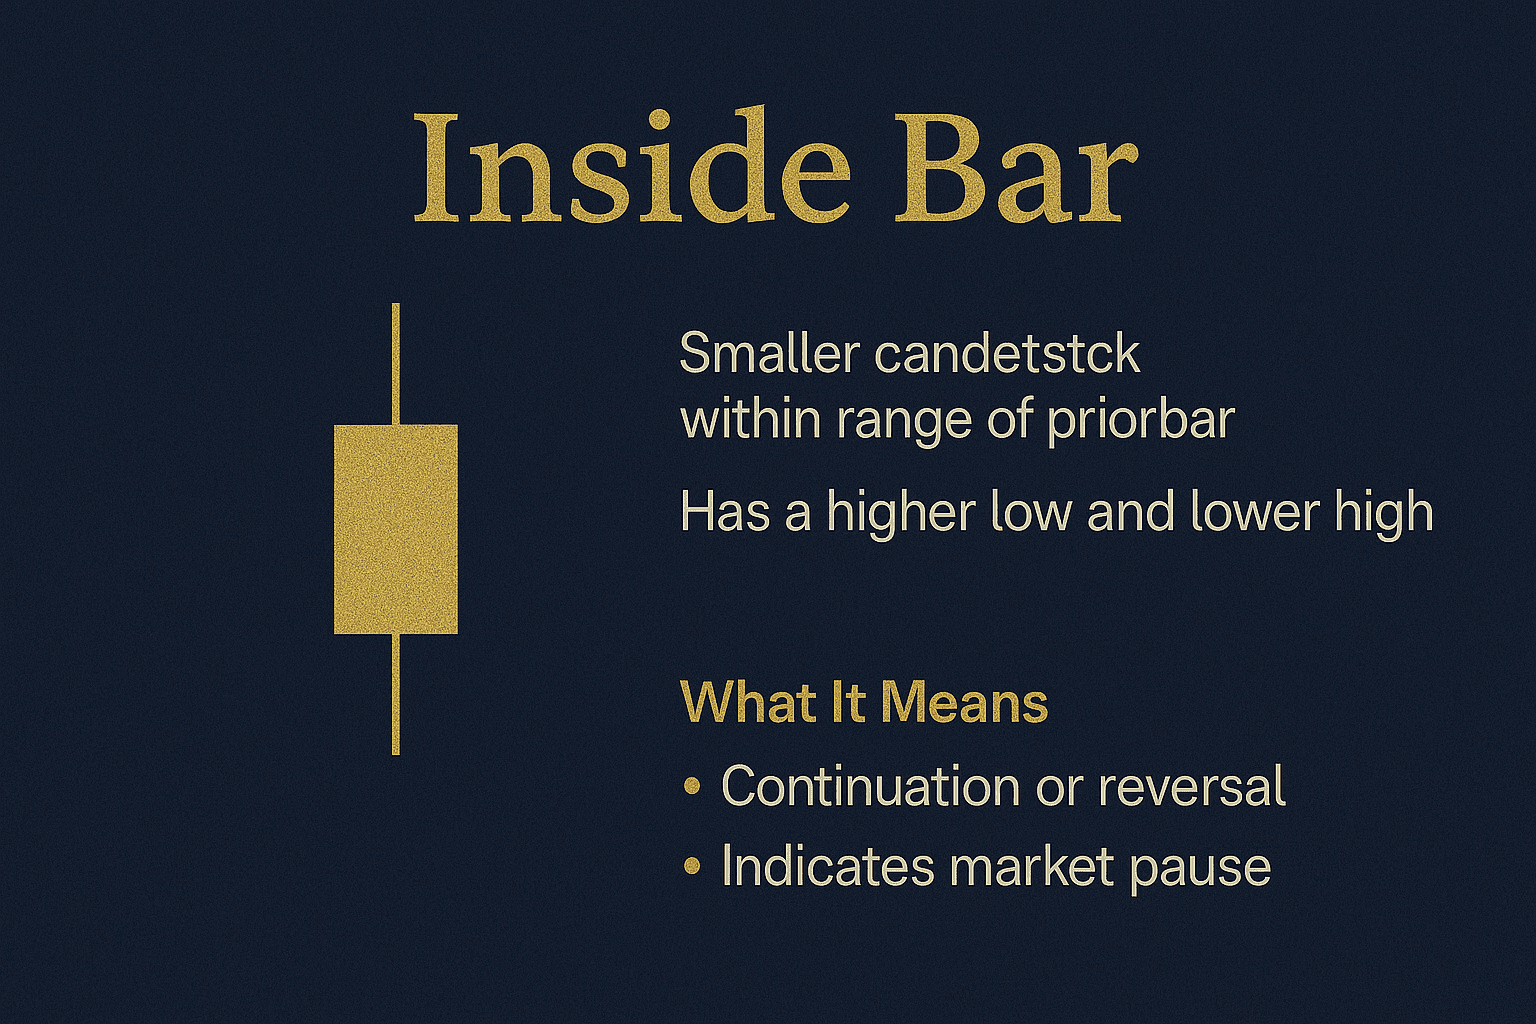
Indication
Low volatility
Pause before major breakout
Works very well with support/resistance areas.
4. Trend Continuation Patterns
4.1 Rising Three Methods
A bullish continuation pattern.
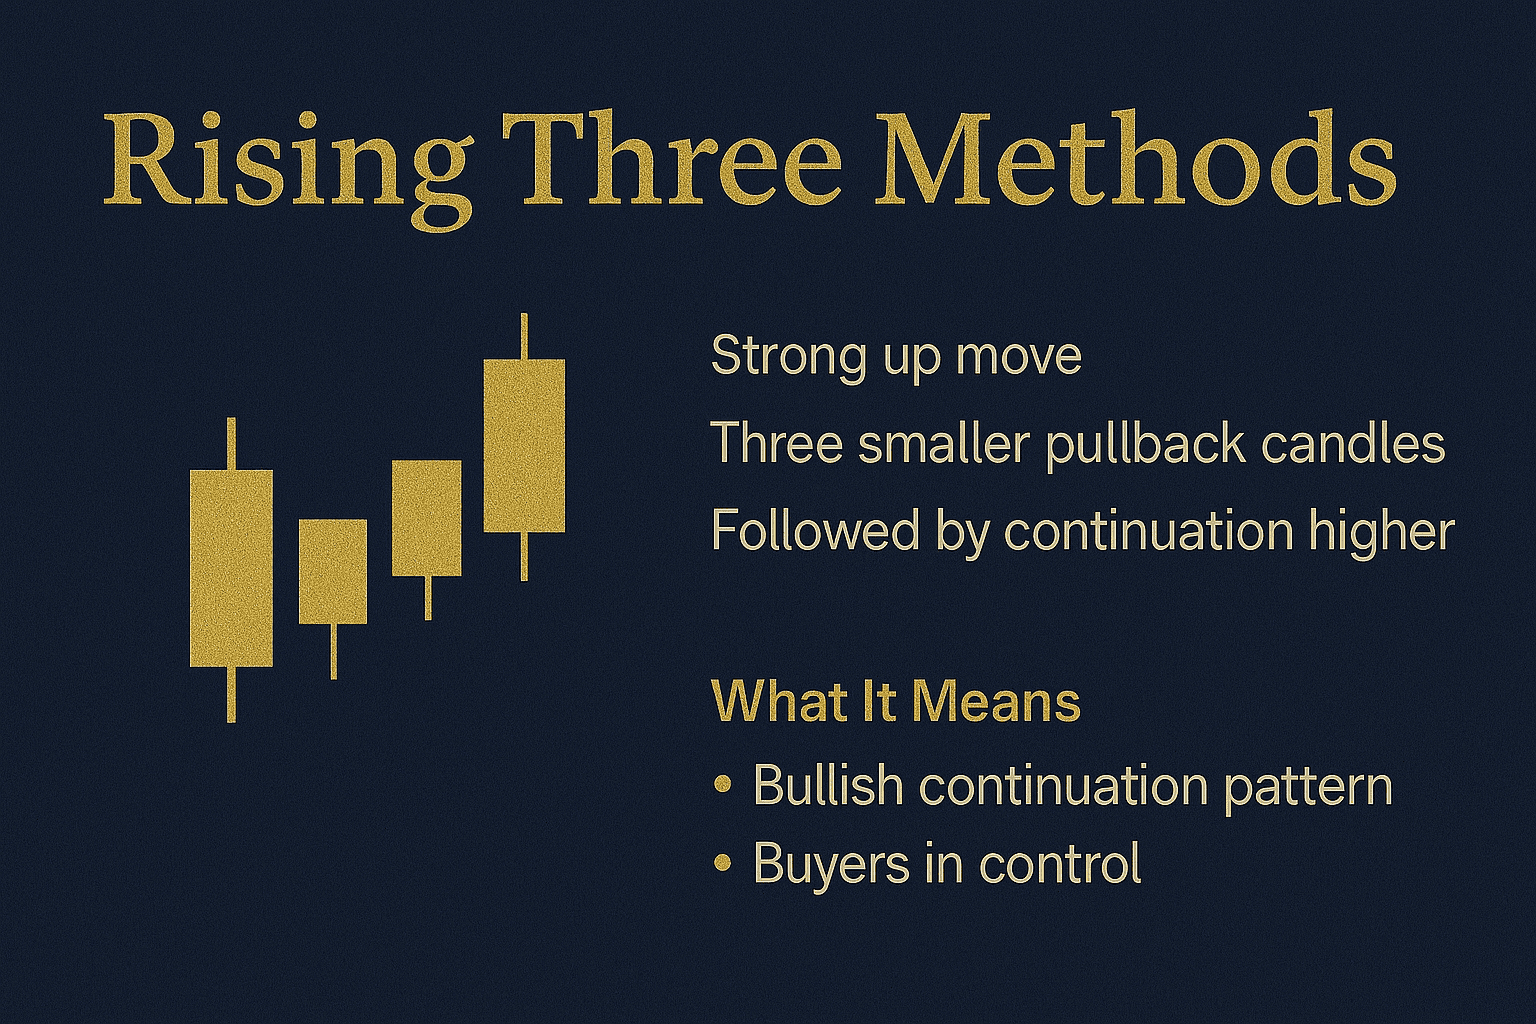
Formation
- Strong bullish candle
- 3–4 small bearish candles within its range
- Another strong bullish candle
Shows buyers remain strong despite temporary pullback.
4.2 Falling Three Methods
Bearish counterpart of the rising three methods.
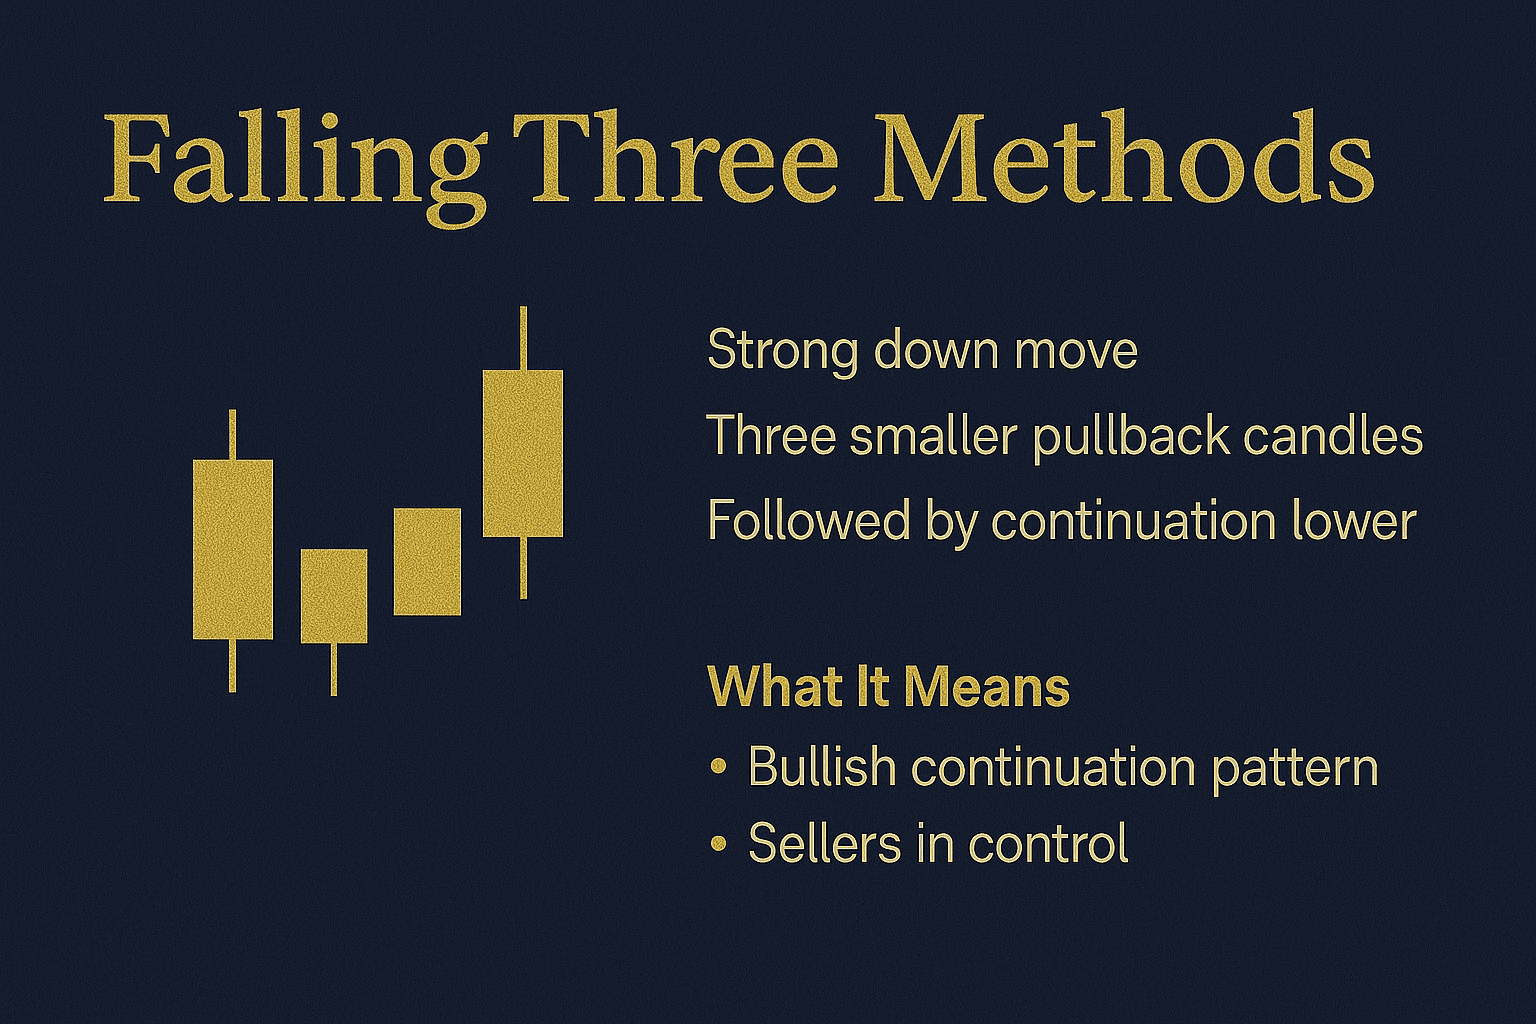
Formation
- Strong bearish candle
- 3 small bullish candles within its range
- Another strong bearish candle
Indicates continuous selling momentum.
5. How to Trade Candlestick Patterns Effectively
5.1 Combine Patterns With Support & Resistance
Candlesticks at random places are meaningless.
But candlesticks at support/resistance are high-probability setups.
5.2 Confirm With Volume
Higher volume = stronger pattern reliability.
5.3 Use Indicators for Confirmation
You can combine:
- RSI
- MACD
- Moving Averages
- Trendlines
This improves accuracy significantly.
5.4 Avoid Trading Every Pattern
Not every pattern results in a trend reversal.
Focus on:
- Market trend
- Chart structure
- Position of the pattern
- Volume confirmation
6. Common Mistakes Traders Make With Candlestick Patterns
❌ Trading patterns without confirmation
❌ Ignoring trend direction
❌ Over-relying on a single candlestick signal
❌ Not checking multiple timeframes
❌ Forcing patterns where there are none
Being patient and waiting for the right setup is essential.
Conclusion
Candlestick patterns are powerful tools, but they work best when combined with other technical analysis elements. By mastering these patterns, a trader can improve decision-making, identify high-probability trades, and manage risk better.
Consistency comes from understanding market psychology—and candlesticks are the easiest way to read that psychology visually.


Leave a Reply