

If you’ve ever opened a stock market app or business news channel and felt confused by numbers, charts, and arrows going up and down — don’t worry bhai, you’re not alone.
Every new investor faces this confusion in the beginning. But once you understand how to read stock market data, you’ll be able to make smarter, more confident investment decisions.
This guide will help you read and understand stock quotes, charts, and market indicators — just like a pro trader. 🚀
💡 What Is Stock Market Data?
Stock market data refers to all the real-time and historical information about a stock’s performance — including its price, trading volume, market cap, and other statistics.
It’s the heartbeat of the stock market — every second, millions of investors buy and sell shares, and this data shows exactly how those actions impact prices.
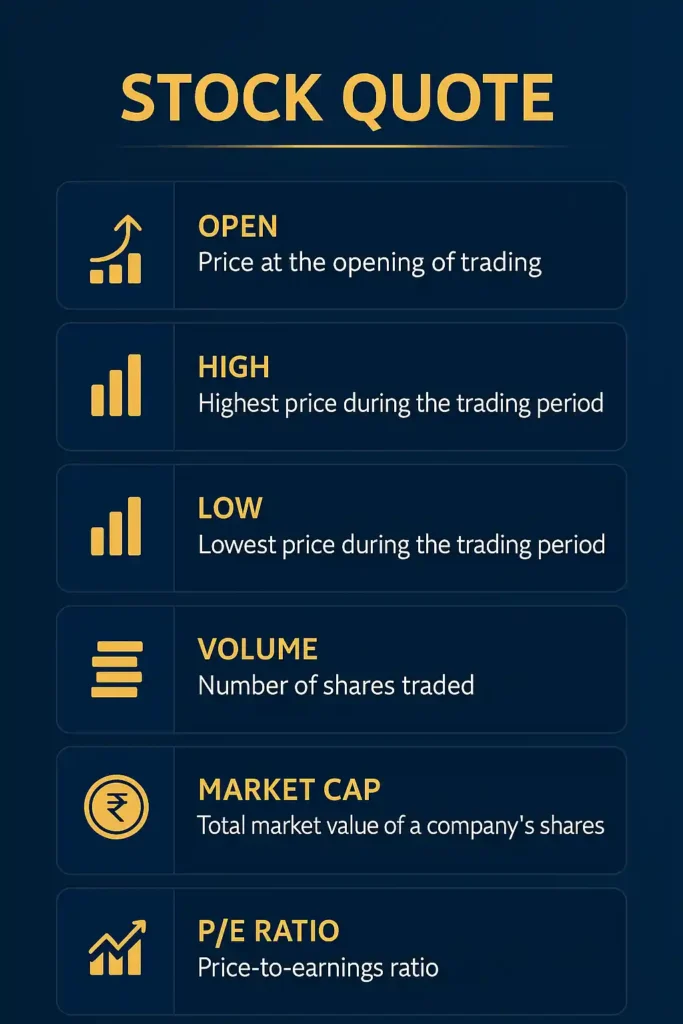
📊 Key Elements of a Stock Quote
When you open your trading app or look at a stock chart, you’ll typically see these key elements:
| Term | Meaning | Example |
|---|---|---|
| Current Price (CMP) | The latest price at which the stock is trading | ₹1,925 |
| Open Price | The price at which the stock started trading for the day | ₹1,900 |
| High / Low | The highest and lowest prices of the day | ₹1,950 / ₹1,890 |
| Previous Close | The stock price at the end of the previous day | ₹1,910 |
| Volume | Total number of shares traded during the day | 3,20,000 shares |
| Market Cap | Total market value of the company | ₹4.5 lakh crore |
| P/E Ratio | Price-to-Earnings ratio, shows valuation | 28.5 |
| 52-Week High/Low | The highest and lowest price in the last year | ₹2,100 / ₹1,600 |
By learning to read these figures, you can easily judge market mood, investor interest, and valuation.
📈 How to Read a Stock Chart
A stock chart visually represents how a stock’s price has moved over time.
It’s the most powerful tool for understanding market trends and patterns.
There are different types of charts, but the two most popular are:
🧩 1. Line Chart
- Simplest form of stock chart
- Plots the closing price of the stock over a period of time
- Great for beginners to identify basic upward or downward trends
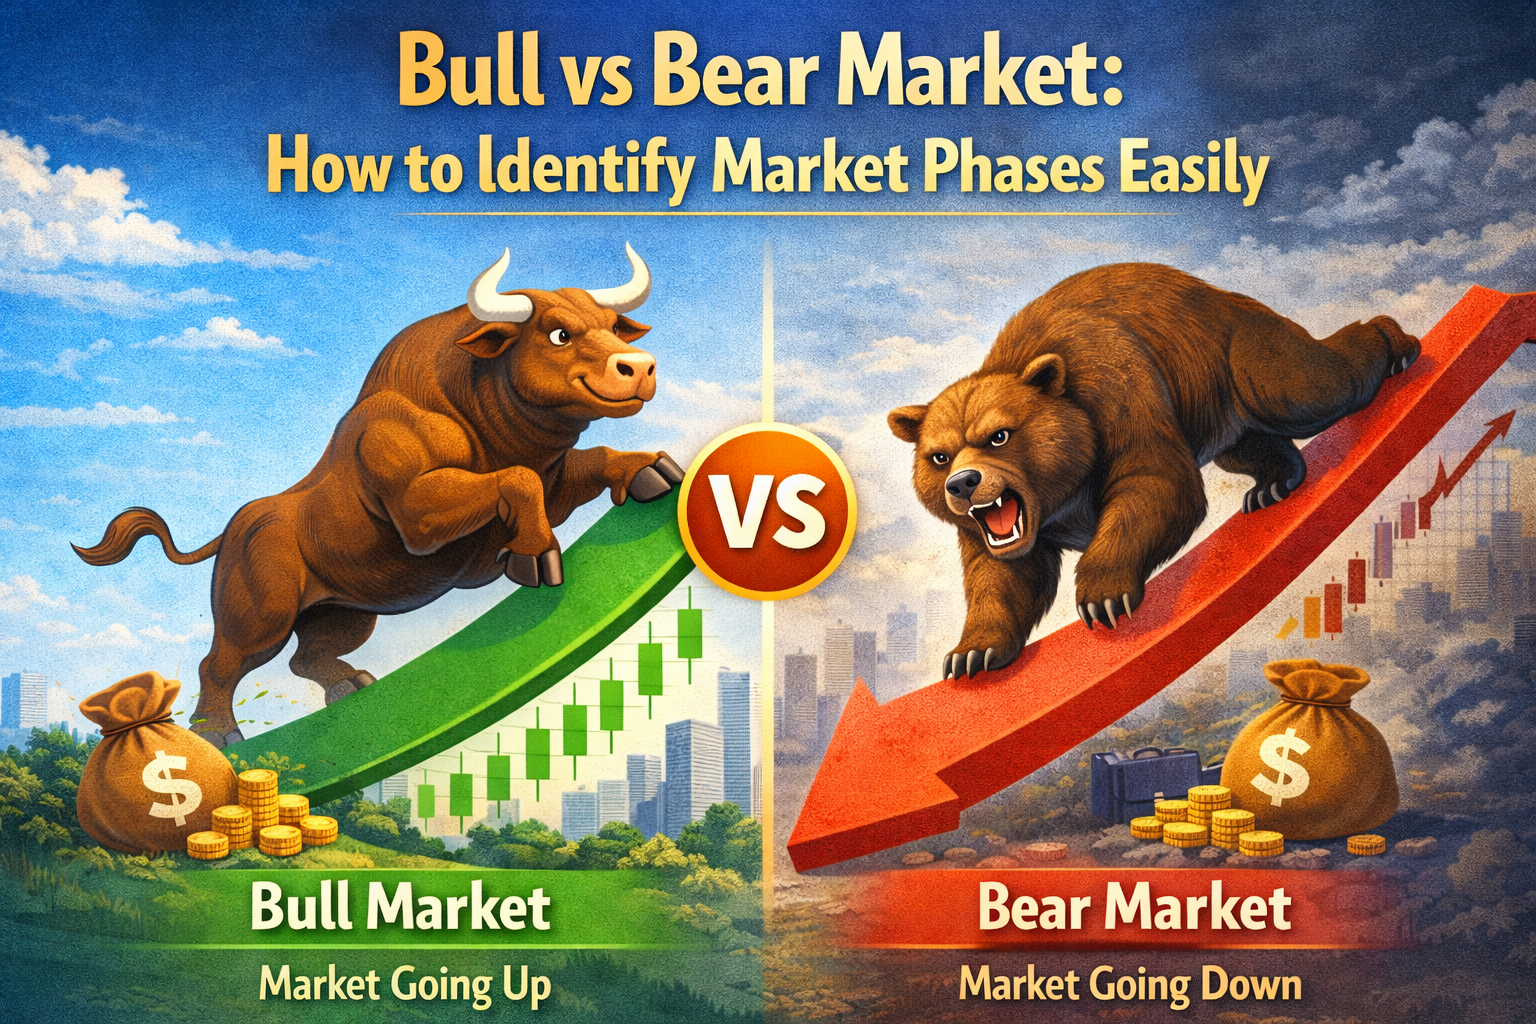
📊 Example: If a line steadily moves upward → bullish trend
If it moves downwards → bearish trend
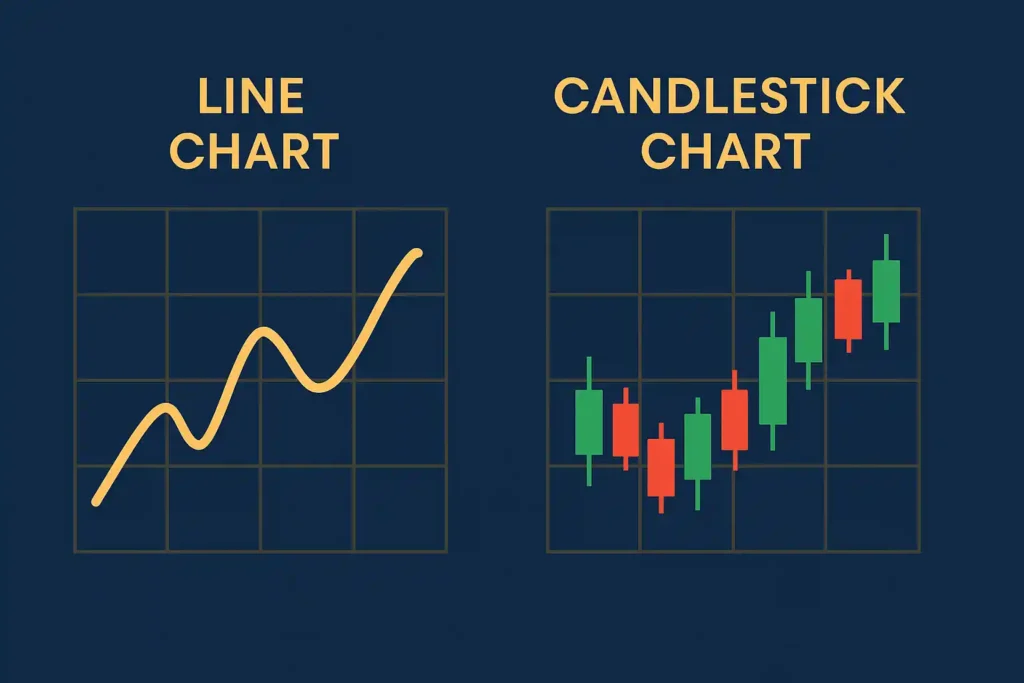
📊 2. Candlestick Chart
Candlestick charts are used by traders to analyze price movement within short time frames.
Each candlestick shows:
- Open price
- Close price
- High price
- Low price
✅ Green Candle: Stock closed higher than it opened (price rose)
❌ Red Candle: Stock closed lower than it opened (price fell)
Reading candlesticks helps identify entry and exit points for buying or selling stocks.
⚙️ How to Read Market Indices
The Sensex (BSE) and Nifty 50 (NSE) are India’s two main indices.
They represent the average performance of top companies and reflect overall market sentiment.
📈 If Sensex/Nifty rises → market sentiment is bullish
📉 If they fall → market sentiment is bearish
Other popular indices:
- Nifty Bank (Banking stocks)
- Nifty IT (Technology companies)
- Nifty Midcap / Smallcap (Smaller companies)
🏦 Understanding Market Depth (Order Book)
The Market Depth or Order Book shows real-time buy and sell orders.
It helps you understand the demand and supply for a particular stock.
| Type | Meaning |
|---|---|
| Bid Price | Price buyers are willing to pay |
| Ask Price | Price sellers are demanding |
| Bid Quantity | Number of shares buyers want |
| Ask Quantity | Number of shares sellers are offering |
👉 If more buyers (high bid qty) → price may rise
👉 If more sellers (high ask qty) → price may fall
💼 Understanding Market Cap and Sector Performance
Market capitalization (Market Cap) tells you the company’s overall size and value.
It helps compare stocks across sectors:
| Type | Range | Example |
|---|---|---|
| Large Cap | ₹20,000 crore+ | Reliance, TCS |
| Mid Cap | ₹5,000–₹20,000 crore | Tata Elxsi, Aurobindo Pharma |
| Small Cap | Below ₹5,000 crore | Happiest Minds, Trident |
Also, by tracking sector performance (like IT, Pharma, Auto, FMCG), you can identify which industry is attracting the most money.
📉 Reading Financial Ratios and Valuation Metrics
Every smart investor checks a few key ratios before buying a stock:
| Ratio | Meaning | Ideal Use |
|---|---|---|
| P/E Ratio | How expensive the stock is vs earnings | Lower = undervalued |
| P/B Ratio | Price vs book value | <1 is undervalued |
| ROE (Return on Equity) | Profitability from shareholder funds | Higher = better |
| Debt-to-Equity | Company’s debt level | Lower = safer investment |
| EPS (Earnings Per Share) | Profit per share | Higher = good company |
These indicators tell whether a company is strong, stable, or risky.
📊 How to Read Volume Data
Volume shows how many shares were traded in a given period.
High volume = high interest or strong news.
Low volume = lack of investor activity.
When prices rise with high volume, it’s a strong bullish signal.
When prices fall with high volume, it’s a strong bearish signal.
💹 Reading Stock Market News and Trends
Every day, news impacts stock prices — earnings results, mergers, government policies, etc.
✅ Positive News: Stock price often rises
❌ Negative News: Stock price often falls
But professional investors don’t react emotionally — they read news with context, comparing it with charts and fundamentals.
🧠 Bonus: How Pros Read Market Sentiment
Smart investors read beyond numbers — they analyze sentiment indicators such as:
- Advance-Decline Ratio (How many stocks are rising vs falling)
- Put-Call Ratio (PCR) (Options market sentiment)
- VIX (Volatility Index) — shows fear level in the market
If VIX is high → market is volatile
If VIX is low → market is calm
🏁 Final Thoughts
Learning to read stock market data is like learning to read a financial story — every price, ratio, and chart tells part of the tale.
The more you practice, the easier it becomes to spot patterns, identify opportunities, and invest smartly.
So open your Demat app, study your favorite stock, and start reading the market like a pro 📈💼


Leave a Reply