

🏛️ Introduction: Two Paths, One Goal — Profitable Investing
The world of investing offers endless opportunities — but also overwhelming choices. Among the most debated topics in finance lies one fundamental question:
👉 Should you rely on Fundamental Analysis or Technical Analysis when investing in the stock market?
Both approaches have loyal followers. Fundamental analysts study company performance and long-term value, while technical traders read price charts and patterns to predict short-term price movements.
In reality, both serve different purposes — and when used wisely, they can complement each other perfectly.
This article will help you understand both concepts deeply, compare their strengths and weaknesses, and guide you on when and how to use each for smarter, data-driven investing.

💡 What Is Fundamental Analysis?
Fundamental Analysis (FA) is the study of a company’s financial health, performance, and intrinsic value to determine whether its stock is worth buying, holding, or selling.
It’s the backbone of long-term investing and widely used by professional investors, mutual funds, and institutions.
The central idea is simple:
“If a stock’s market price is below its true value, it’s a buying opportunity.”
🔍 Key Elements of Fundamental Analysis
- Earnings and Profitability
- Analysts examine the company’s revenue, net income, and profit margins.
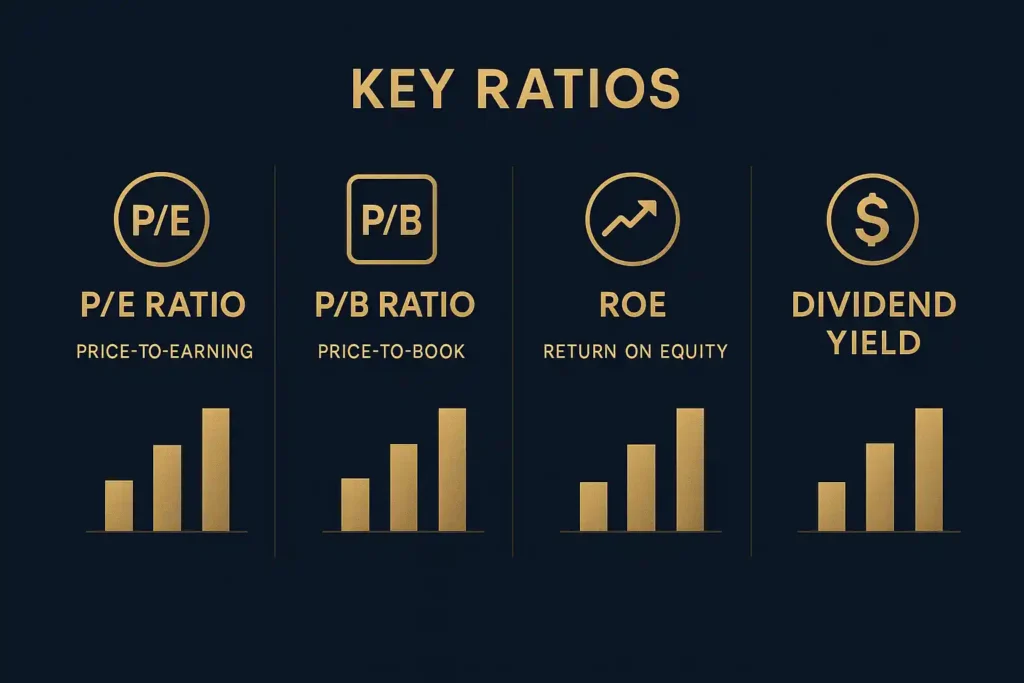
- Metrics like Earnings Per Share (EPS) and Return on Equity (ROE) are crucial for evaluating performance.
- Valuation Ratios
- P/E Ratio: Compares price to earnings — used to gauge if a stock is overvalued or undervalued.
- P/B Ratio: Price compared to book value — useful for asset-heavy companies.
- PEG Ratio: Growth-adjusted valuation for future potential.
- Financial Statements
- The Balance Sheet shows assets vs liabilities.
- The Income Statement reveals profitability trends.
- The Cash Flow Statement highlights liquidity and solvency.
- Economic & Industry Factors
- Analysts also consider interest rates, inflation, GDP growth, and sector performance.
📈 Objective
To identify companies with strong fundamentals that can generate consistent returns over time.
🧠 What Is Technical Analysis?
Technical Analysis (TA), on the other hand, is the art and science of studying market price movements.
Rather than evaluating a company’s inner financials, it focuses on price charts, trading volume, and market trends to forecast future price behavior.
The principle behind technical analysis:
“Market price reflects all known information — so price patterns reveal investor psychology.”
📊 Core Concepts in Technical Analysis
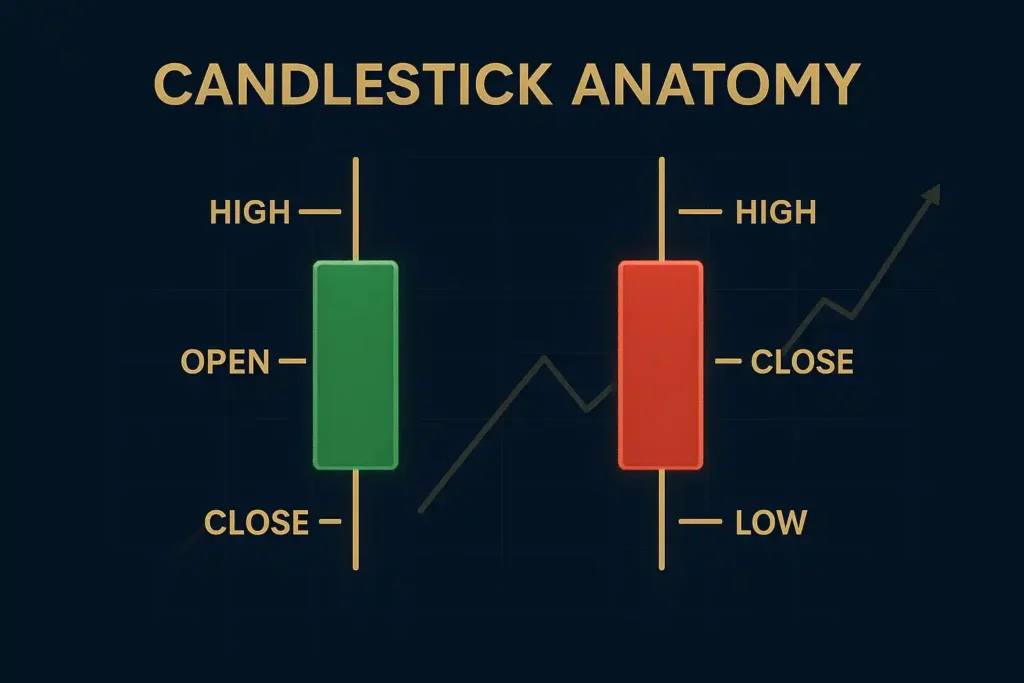
- Price Charts
- Line charts, bar charts, and candlestick charts display price movements over time.
- Candlestick patterns (like “Doji,” “Hammer,” “Shooting Star”) give insights into trend reversals.
- Support and Resistance Levels
- Support: A price level where demand tends to increase.
- Resistance: A level where selling pressure usually emerges.
- Indicators and Oscillators
- Moving Averages (MA): Identify trend direction.
- Relative Strength Index (RSI): Measures overbought or oversold conditions.
- MACD: Tracks momentum and crossovers for trend confirmation.
- Bollinger Bands: Help assess volatility.
- Volume Analysis
- Volume spikes often confirm price moves or signal potential reversals.
🎯 Objective
To predict short- to medium-term price trends and make quick trading decisions for profit optimization.
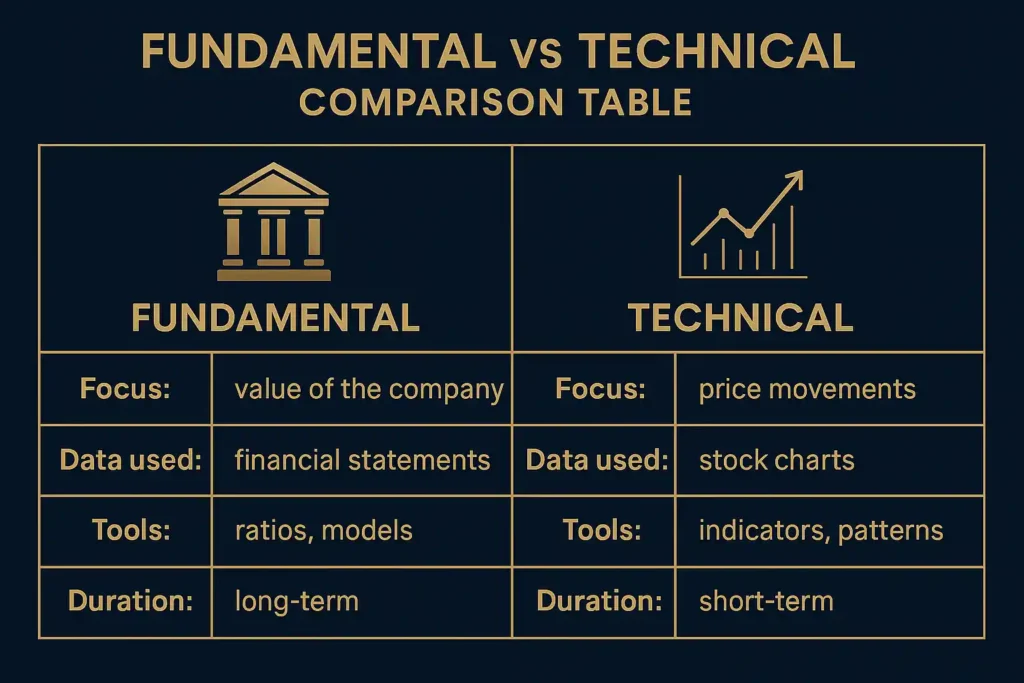
⚖️ Comparison: Fundamental vs Technical Analysis
| Aspect | Fundamental Analysis | Technical Analysis |
|---|---|---|
| Focus | Company’s financials and intrinsic value | Price movements and market trends |
| Time Horizon | Long-term (months/years) | Short-term (minutes/weeks) |
| Data Type | Financial statements, macroeconomic data | Price charts, volume, indicators |
| Purpose | Identify undervalued or overvalued stocks | Predict price direction and timing |
| Used By | Investors, analysts, fund managers | Traders, swing traders, day traders |
| Tools Used | P/E ratio, EPS, balance sheets | RSI, MACD, moving averages |
| Philosophy | “Buy good companies at a fair price.” | “Price discounts everything.” |
🧩 Which One Should You Use?
The choice depends entirely on your investment goals and time horizon.
✅ Use Fundamental Analysis If:
- You are a long-term investor.
- You prefer analyzing company performance and intrinsic value.
- You are focused on wealth building over time, not quick profits.
- You’re investing in blue-chip or growth stocks.
✅ Use Technical Analysis If:
- You are a short-term trader.
- You thrive on market timing and quick decision-making.
- You follow daily price movements and want to capitalize on volatility.
- You use stop-losses and chart-based strategies for trading.
✅ Combine Both for Maximum Impact:

Professional investors often use a hybrid approach —
- Use Fundamental Analysis to identify quality stocks.
- Use Technical Analysis to decide when to enter or exit.
This blend allows investors to make data-backed, emotion-free decisions, increasing both confidence and profitability.
🧮 Real-World Example
Let’s take Infosys Ltd. (NSE: INFY) as an example.
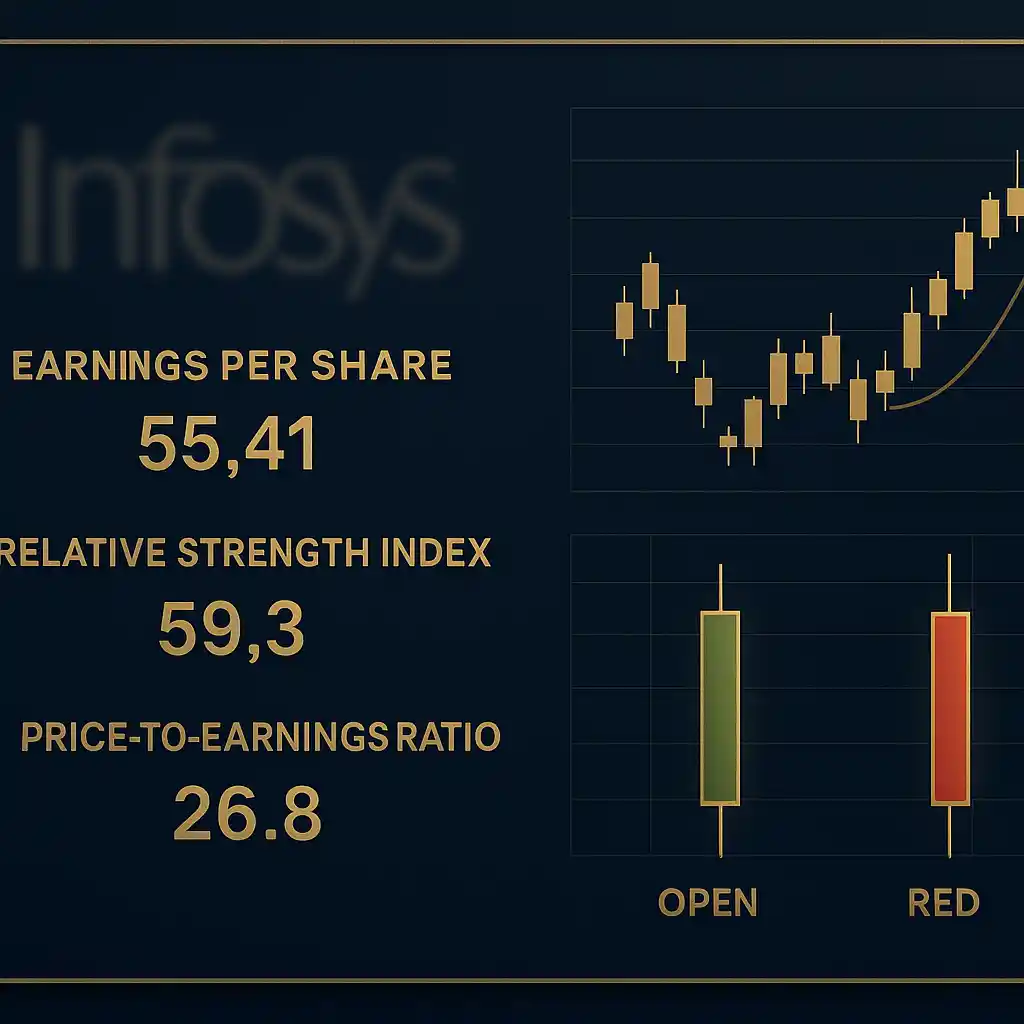
- Fundamental Analysis View:
Infosys has strong earnings, global presence, and a history of stable dividends — indicating a solid long-term investment. - Technical Analysis View:
A short-term trader might note RSI nearing 70 (overbought) and plan to book partial profits.
Both are correct — the fundamentalist sees long-term growth, while the technician sees near-term price behavior.
🧭 How Beginners Can Start
- Learn Basic Accounting – Understand balance sheets and cash flows.
- Study Chart Patterns – Learn simple patterns like support/resistance and moving averages.
- Use Reliable Tools – Start with free platforms like TradingView or Yahoo Finance.
- Follow Market News – Keep track of quarterly earnings, interest rates, and policy changes.
- Build Discipline – Avoid emotional trading; stick to strategy.
💬 Expert Insight
Most successful investors — from Warren Buffett to Rakesh Jhunjhunwala — primarily use fundamental analysis for long-term wealth creation.
However, professional traders like Paul Tudor Jones and John Bollinger rely on technical signals for short-term gains.
This shows that no single method guarantees success. What matters is consistency, learning, and disciplined execution.
🧾 Conclusion: The Smart Investor’s Formula

In summary:
- Fundamental Analysis helps you choose what to buy.
- Technical Analysis helps you decide when to buy or sell.
Smart investors master both — using fundamentals to identify valuable stocks and technicals to refine their entry and exit points.
By combining these methods, you can balance long-term growth with short-term agility — the ultimate path to sustainable wealth creation.


Leave a Reply